
 Home
Home News
News

- 1 ANKR’s price is currently trading at $0.025 with a 53% gain in the 7-day trading volume.
- 2 ANKR observed a decline of 4.13% in the last week.
The ANKR token price is trading near its recent demand level. Though in the bigger picture, it is near its neck level in the market structure. The major trend for the ANKR price is currently bearish according to the price action. After making a double top pattern near $0.0400 the price broke its market structure and saw a decline of 31% within 4 weeks.

The majority of technical indicators are presently favoring the bear trend on the daily timeframe. Presently It is trading below all the 20,50,100,200 key averages; taking resistance from the 200 MA. The Oscillators are trading against each other. Where the Stochastic RSI is trading near the overbought level on the other hand the RSI line is trading near oversold levels.

The value of the ANKR coin is $0.025, Its Market Cap is around $258.21M.
Investors’ Total Bullish and the Bearish Sentiments
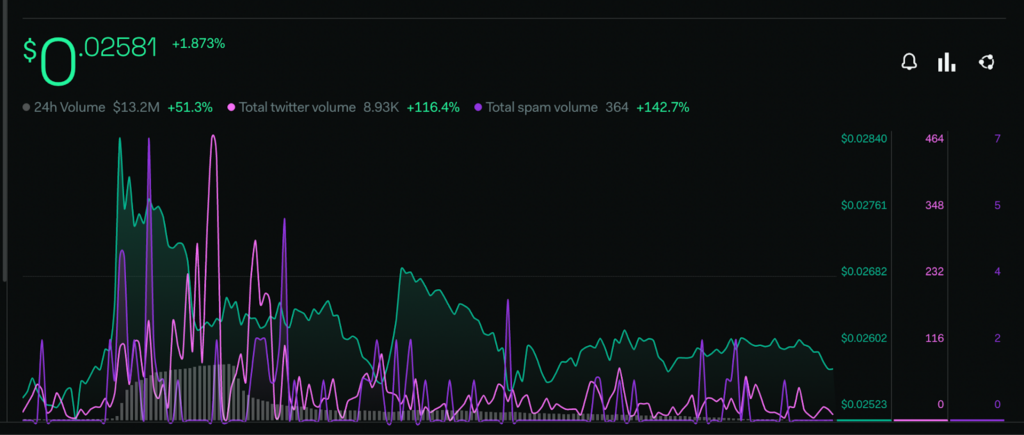
Investors’ sentiments regarding the ANKR seem to be taking a bearish turn. The total bearish sentiment rate has surged up by 119.3% whereas the Social Engagement metrics have also increased significantly by 101.8% according to LunarCrush.
Previously near early April, the price of ANKR took support from $0.02600 gaining more than 50% of its value though the price was not able to breach its resistance near $0.0400. After taking a correction of 21% the price made another attempt to make a breakout however their efforts were futile against the substantial barrier.
The price made a bearish double-bottom pattern after making an engulfing red candle it lost 30% of its overall value.
Technical Analysis of ANKR
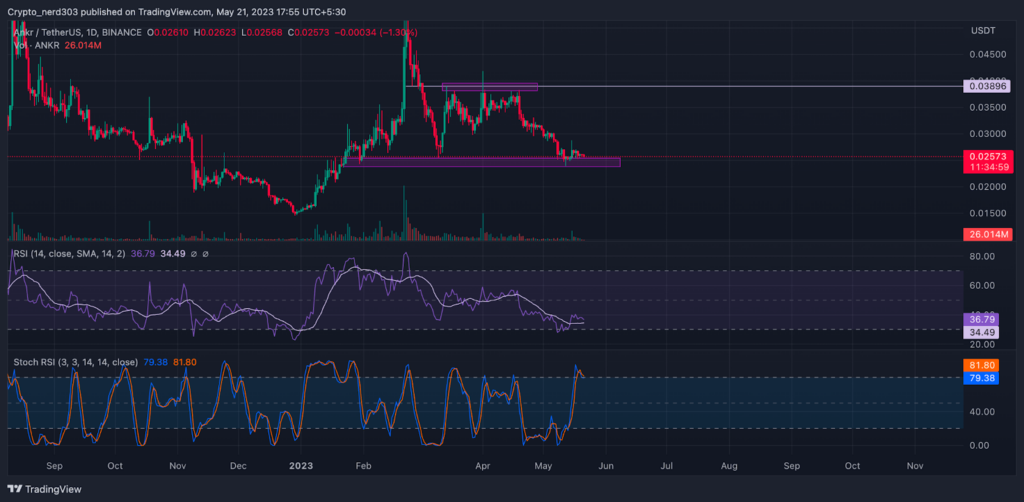
The RSI line is attempting to make a positive rebound from the oversold levels. It recently breached the 14 SMA line near 30 RSI points. As of now, the value of the RSI line is 36.79 points, above the 14 SMA which is at 34.49.
At present the stochastic RSI is moving in contrast with RSI at oversold levels. The current value of stochastic RSI is 81.80 points. The %K line has given a bearish interception to the %D line.
Conclusion
As per the analysis, ANKR price is presently trading under crucial EMA and MA levels in a bear trend. The RSI line is suggesting that the price may attempt to make a bullish recovery though the stochastic RSI is against it.
Technical levels –
Support -$0.02400 and $0.0200
Resistance – $0.03500 and $0.0300
Disclaimer
The views and opinions stated by the author, or any people named in this article, are for informational purposes only, and they do not establish financial, investment, or other advice. Investing in or trading crypto assets comes with a risk of financial loss.

Nancy J. Allen is a crypto enthusiast, with a major in macroeconomics and minor in business statistics. She believes that cryptocurrencies inspire people to be their own banks, and step aside from traditional monetary exchange systems. She is also intrigued by blockchain technology and its functioning. She frequently researches, and posts content on the top altcoins, their theoretical working principles and technical price predictions.


