
 Home
Home News
News
- 1 The SIA price is currently trading at $0.0034 near the demand zone.
- 2 The SIA price has been observing an increase of 0.0021% in the last 24 hours.
Followed by a sharp selloff of 24% within the last 2 weeks, SIA’s price is currently trading under a strained consolidation channel, it is taking support from the 200 MA. The thin consolidation suggests that there is a buildup of buying and selling pressure and the price may soon give a breakout with strong momentum. The SIA price has considerable resistance levels if it takes a bullish turn as it is trading below 100 and 200 EMA on the daily timeframe.
Over the previous few months, the price has not been successful in breaking its major resistance level near $0.00440 which is proving to be a critical barrier for the buyers.
The present value of SIA is 0.0034$, It has a total Market Cap of $180.16M
Increase in Social Engagement levels and Decline in Bullish Sentiment
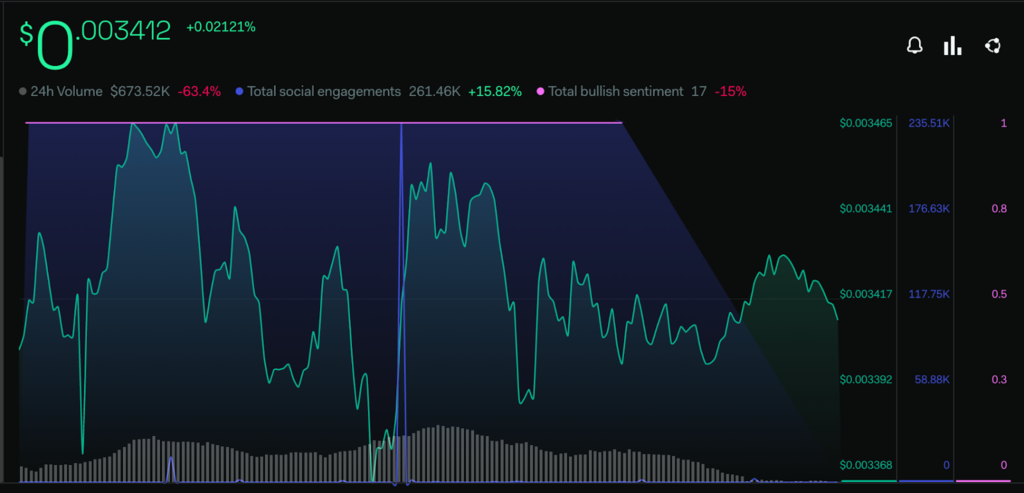
Investor sentiments regarding the SIA coin are taking a Bearish turn. The Total bullish sentiment metrics provided by LunarCrush have observed a slight decline of 15% within the last week. The Total Social engagement metrics indicate increased activity in the community regarding the token which has surged by 15.82%.
Technical Analysis (1 Day Timeframe )
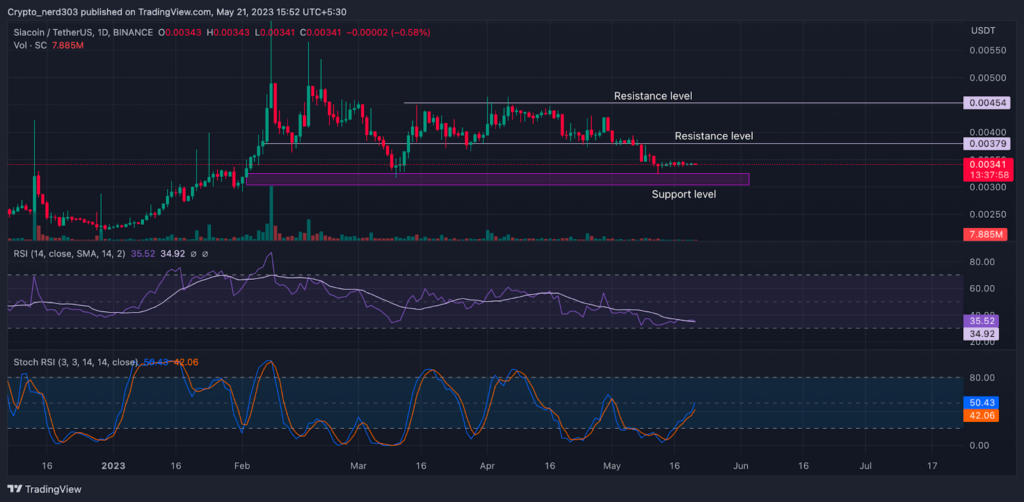
The RSI line is observing a steady decline after taking rejection from 60 points. The present RSI value is 35.52 points and the value of 14 SMA is 34.92 points. The RSI line is taking resistance from the 14 SMA on the daily timeframe at present. If it succeeds in breaking above the current resistance the price may take a bullish turn.
At present the stochastic RSI is giving a bullish divergence. It is steadily moving towards overbought levels after taking rejection from the median line. The current value of stochastic RSI is 50.43 points. The %K line is crossing above the median after making a double bottom pattern and the %D line is close behind it.
Conclusion
As per the analysis, If the price gains buyers’ support from this level it may make a substantial recovery though the price might face considerable obstacles before attaining its target. The Stochestic RSI is taking a bullish divergence; the RSI line is yet to cross above the 14 SMA line. The SIA price suggests that it is ready to make a breakout.
Technical levels –
Support – $0.0030
Resistance – $0.0040 and $0.0045
Disclaimer
The views and opinions stated by the author, or any people named in this article, are for informational purposes only, and they do not establish financial, investment, or other advice. Investing in or trading crypto assets comes with a risk of financial loss.

Andrew is a blockchain developer who developed his interest in cryptocurrencies while pursuing his post-graduation major in blockchain development. He is a keen observer of details and shares his passion for writing, along with coding. His backend knowledge about blockchain helps him give a unique perspective to his writing skills, and a reliable craft at explaining the concepts such as blockchain programming, languages and token minting. He also frequently shares technical details and performance indicators of ICOs and IDOs.


