
 Home
Home News
News

- 1 The XLM price is currently trading at $0.0878; seeing a change of 24.86% in 24-hour trading volume.
- 2 The XLM price is observing a decline of 0.99% in the last 24 hours.
- 3 The XLM price is predicted to decline further within the next week.
The XLM price is currently trading under the bear’s grip after getting rejected from the $0.0110. The price may see a further decline in its value within the next week as a significant presence of the sellers is present in the market. It is currently making a lower high and low pattern on the daily timeframe. The price is currently trading within a narrow consolidation channel.

The technical indicators are in support of the analysis. The Oscillators are taking a reversal from their resistance zones whereas the price is trading below key EMA and MA levels. Analyzing the historical price action, it has been following a pattern of consolidation and breakdown.
Change of Investors Sentiments Regarding XLM Token
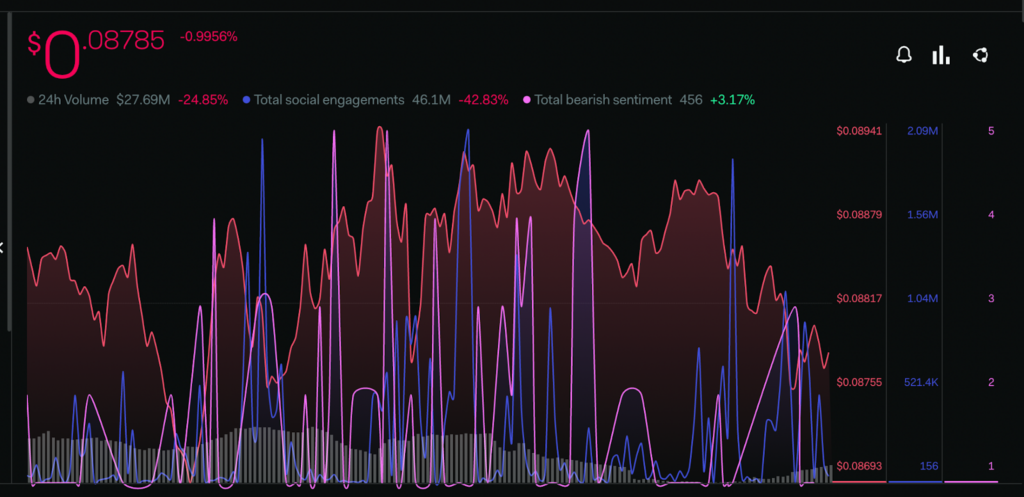
The LunarCrush metrics are indicating that there is a sharp decline in total bullish sentiments of the investors across various media platforms. The total bearish sentiment rate has observed a decline of -42.83% within the last 7 days which is also being reflected in the price action. On the contrary, the total bearish sentiment rate is seeing a slight increment.
Decrease in Total Value Locked of XLM Token
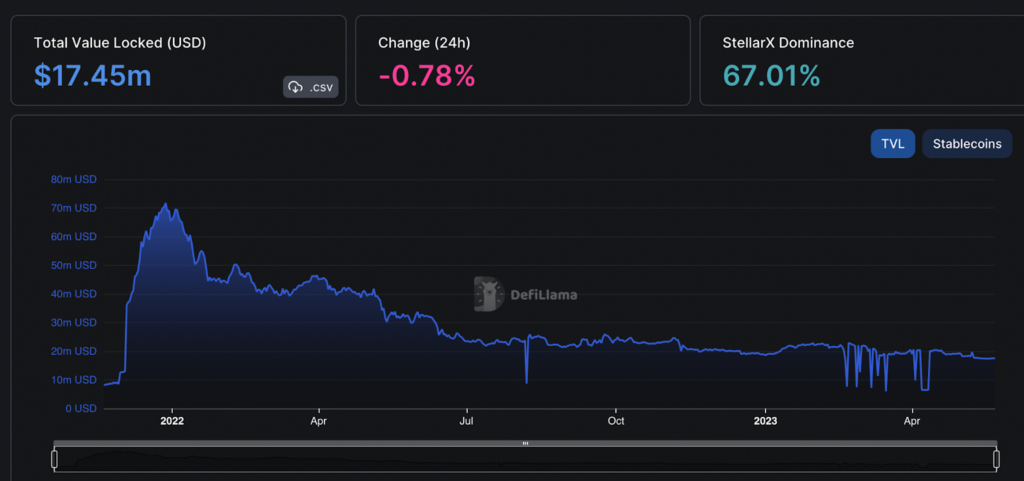
The TVL of the XLM coin is currently projecting the declining confidence of the buyers in tokens. After making its all-time high near last January in 2022 when the TVL of Steller was 70M, it is recording a significant decline. The present TVL of XLM is 17.45M.
Technical Analysis (1 Day Timeframe)
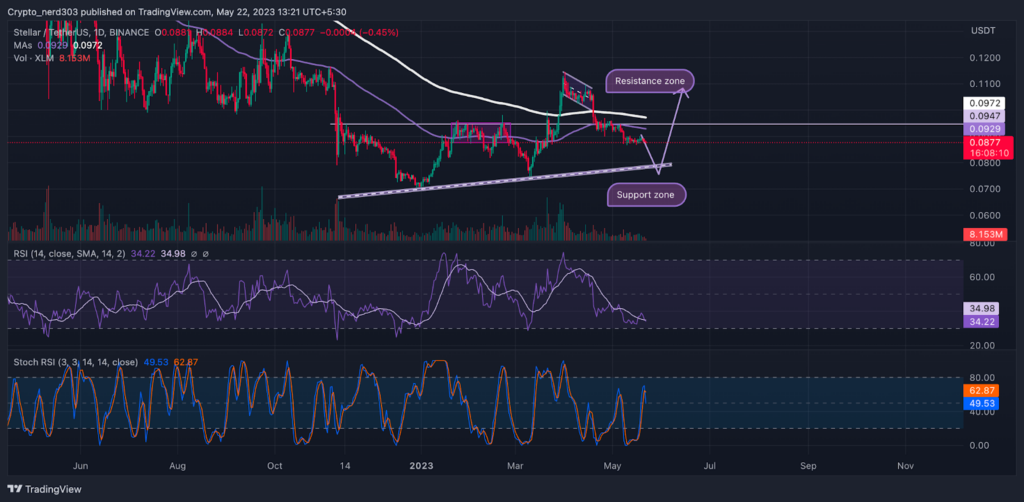
The RSI line has been moving in a downtrend; taking constant resistance from the 14 SMA. Though recently after taking a reversal from the oversold zone the RSI line gave a positive interception to 14 SMA but could not sustain above it. The current RSI value is 34.22 while the 14 line is trending near the median line around 34.98 points.
Stochastic RSI is trading above the median line where the %K line recently gave a bearish interception to the %D line on the daily timeframe. The present value of Stochastic RSI is 48.53 points.
Conclusion
According to the analysis, presently, the price is trading under a thin consolidation channel. According to historical price action and technical indicators, the price can take a bearish correction as the price is taking severe resistance from the 100 and 200 EMA levels.
Technical levels –
Support- $0.0800
Resistance- $0.1100
Disclaimer
The views and opinions stated by the author, or any people named in this article, are for informational purposes only, and they do not establish financial, investment, or other advice. Investing in or trading crypto assets comes with a risk of financial loss.

With a background in journalism, Ritika Sharma has worked with many reputed media firms focusing on general news such as politics and crime. She joined The Coin Republic as a reporter for crypto, and found a great passion for cryptocurrency, Web3, NFTs and other digital assets. She spends a lot of time researching and delving deeper into these concepts around the clock, and is a strong advocate for women in STEM.


