
 Home
Home News
News
- 1 The LINK price is currently trading at $6.523 while seeing a change of 29% in 24-hour trading volume.
- 2 The LINK price is observing an increase of 0.35% in the last 24 hours.
The LINK price is presently moving within a range. The price after seeing a major 70% bearish decline in early May started trading sideways. At present it is trading near the demand zone of the broad consolidation. According to the historical price action, it may find the buyers to support it near the current level.
In the previous analysis, it was estimated that the price of LINK can see a further decline in its value after facing a rejection. The analysis was proven correct when the price fell by 16% within the next few weeks.
Stangency in Revenue and Fees of LINK Token
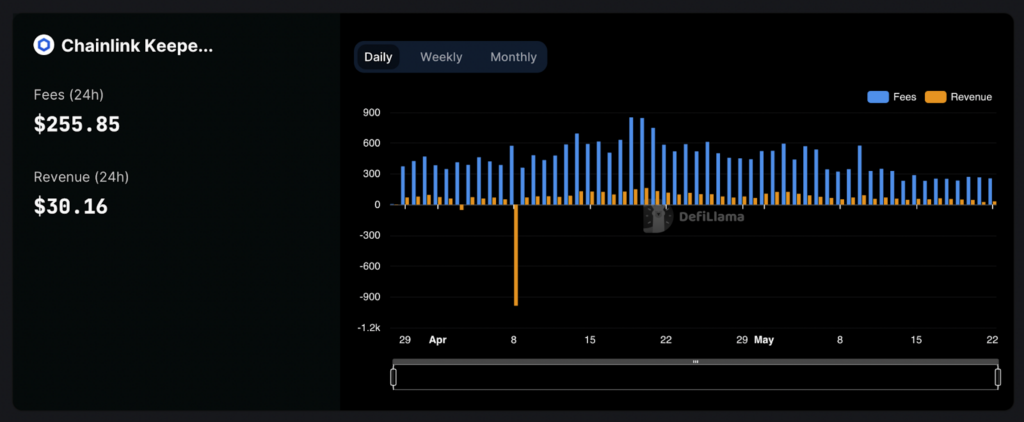
The Fees and Revenue of the LINK price have been stagnant for the past few months. However, it is observing a slight decline within the past few days. The total fees generated by Chainlink in May is 8.08K and revenue is 1.62K.
Greed and Fear Index of Overall Market Sentiments
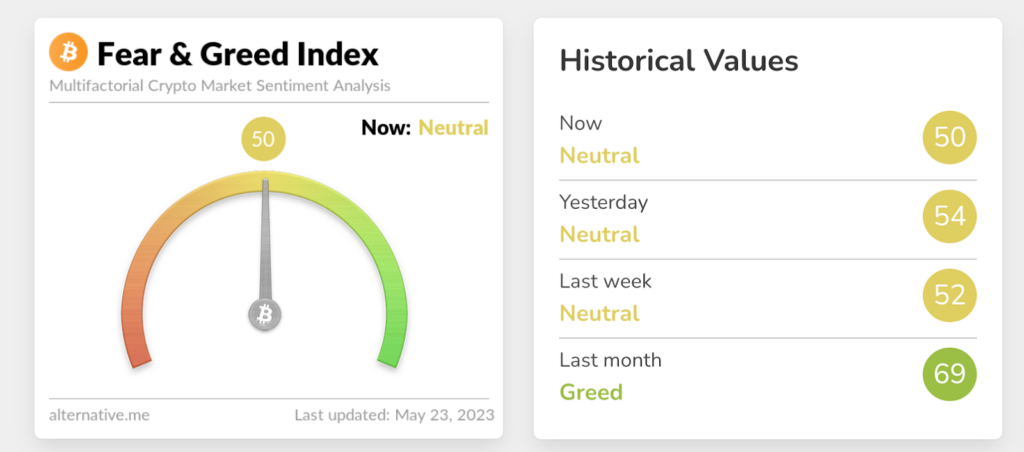
The majority of market sentiments have been moving near the Neutral zone for the past few weeks. Currently, its value is 50 points in the index seeing a slight decrease of 2 points within recent days. The decrease in the value was observed within the last week when the market was trading at around 52 points, As per the Greed and Fear Index provided by the Alternative(dot)me.
Technical Analysis ( 1 Day Timeframe )
The RSI line is attempting to cross above the median line after taking several rejections. The value of the RSI line as of now is 42.45 points, while the 14 SMA is giving support to it around 41.80 points.
The stochastic RSI produced a crossed above the median line. The %D line recently intercepted the %K line above 50 points. The Stochastic RSI suggests that the price of LINK may continue to make a bullish move in recent days. The lines have already started moving toward the overbought zone.
Conclusion
The technical indicators are favoring the bulls. Though EMA lines are providing strong resistance to the price while the oscillators are already reaching the demand zone. The price has been making constant predictable movements for the last few months which may prove to be beneficial for short-term investors. It is estimated according to the analysis that the price may continue to trade under a range until a breakout is made.
Technical levels –
Support –$5.300 and $7.000
Resistance – $9.000 and $7.615
Disclaimer
The views and opinions stated by the author, or any people named in this article, are for informational purposes only, and they do not establish financial, investment, or other advice. Investing in or trading crypto assets comes with a risk of financial loss.

With a background in journalism, Ritika Sharma has worked with many reputed media firms focusing on general news such as politics and crime. She joined The Coin Republic as a reporter for crypto, and found a great passion for cryptocurrency, Web3, NFTs and other digital assets. She spends a lot of time researching and delving deeper into these concepts around the clock, and is a strong advocate for women in STEM.


