- 1 Optimism’s price is currently trading at $1.69, with an increase of +3.86% during the intraday session.
- 2 The year-to-date return of OP is 84.64%, while the 3-month return is -32.17%.
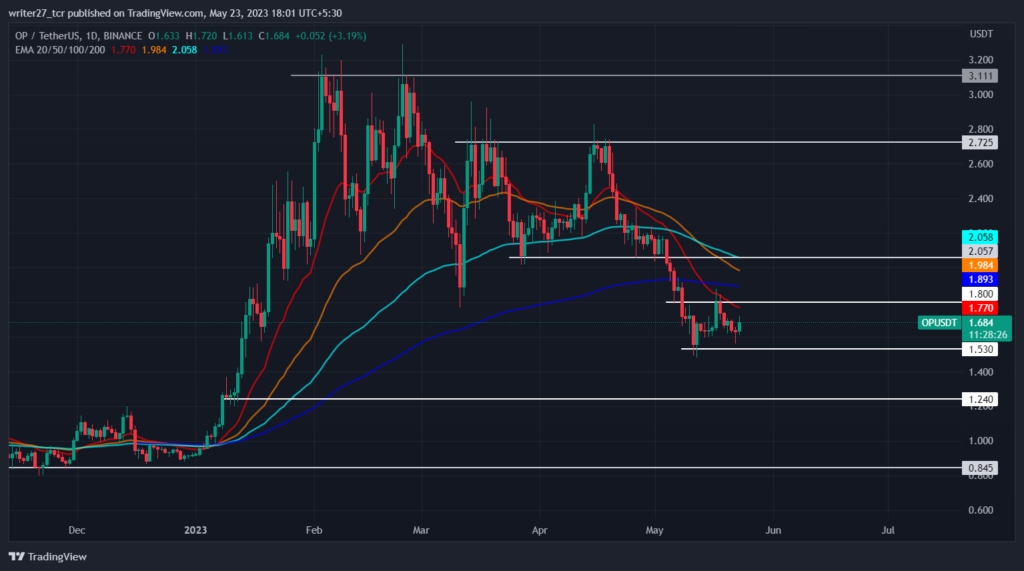
- 3 OP price trades below 20,50,100, and 200-day EMAs.
OP’s price recently shattered a strong support level of $1.85 in the downward direction, and the price melted down to the $1.53 level. This drop caused a loss of approximately 16% in the price. The price gained bullish momentum to retest the previous consolidation zone and was rejected by the $1.85 level. Bears pushed the price downward, forming minor support at the $1.63 level. The current candle is bullish and is headed toward the resistance level of $1.85.

If bears can push the price below the recent support, there is a higher probability for the price to melt down to the $1.24 level causing a drop of roughly 18%. On the other hand, if bulls can push above the $2 level, the price might again enter the consolidation zone. For the price to shift trend to bullish, it must rise above all the significant EMAs and the $2.05 level.
Optimism Sets June Date For Biggest Ever Upgrade
Optimism is a layer-2 scaling solution for the Ethereum blockchain and is ready for its most significant upgrade, “bedrock,” on June 6. The upgrade, a hard fork, was proposed at the start of the year and approved by the Optimism community in April.
The upgrade will offer a new modularity, simplicity, and Ethereum equivalence for the layer two solutions. There is competition going on for becoming the top Ethereum scaling solution.
Currently, Arbitrum is the industry leader, followed by Optimism. The upgrade will give an edge to Optimism. The upgrade might show a positive effect on the price. Let’s see where OP’s price might head before June 6.
Will OP Price Shift To Bullish Trend?

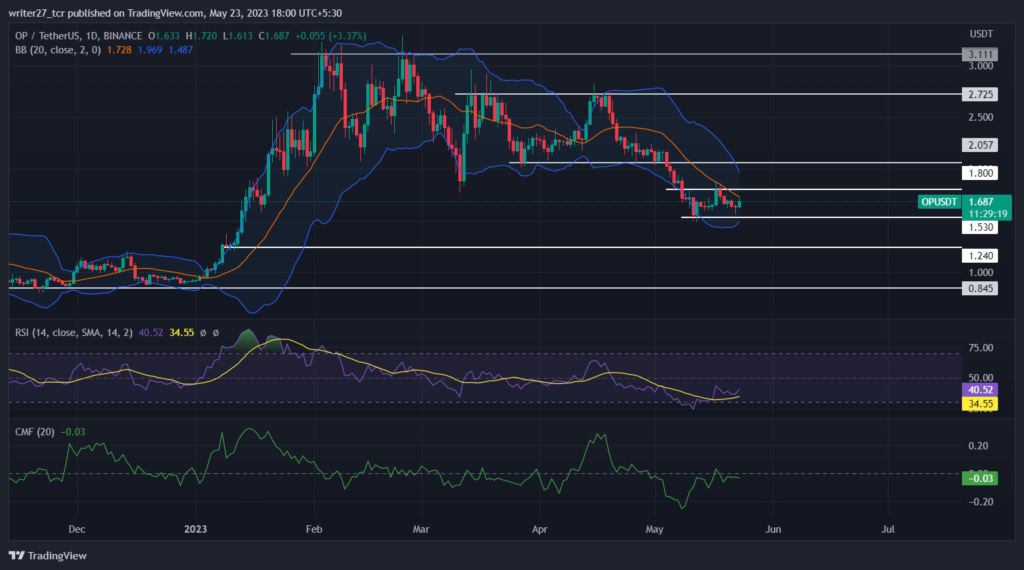
Optimism price is trading below major EMAs, indicating bearish momentum in the price. The relative strength index did bounce back from the oversold zone and is currently at 41.16, suggesting that the price is slowly gaining bullish momentum, but it should cross the 60 mark to confirm the strength.
Chaikin money flow score is -0.03, indicating weakness in the market, and the current move might be just a short-term pullback for the price. OP price is experiencing rejection from the 20-day SMA of the Bollinger, indicating that the price might again head toward the lower band of the Bollinger.
The long/short ratio is 1.01, with 50.26% longs and 49.74% shorts, indicating a slightly higher presence of bulls in the last 24 hours.
Conclusion
The overall market structure and price action for Optimism is bearish, although the price is currently stuck in a narrow consolidation zone. The technical parameters indicate that the price might break the recent support and fall further. The upgrade is on the way for Optimism on June 6; investors will look forward to seeing how the price will react before the upgrade.
Technical Levels
Major support: $1.53 and $1.24
Major resistance: $2.05 and $2.725
Disclaimer
The views and opinions stated by the author, or any people named in this article, are for informational purposes only. They do not establish financial, investment, or other advice. Investing in or trading crypto assets comes with a risk of financial loss.

Nancy J. Allen is a crypto enthusiast, with a major in macroeconomics and minor in business statistics. She believes that cryptocurrencies inspire people to be their own banks, and step aside from traditional monetary exchange systems. She is also intrigued by blockchain technology and its functioning. She frequently researches, and posts content on the top altcoins, their theoretical working principles and technical price predictions.


 Home
Home News
News


