
 Home
Home News
News
- 1 Helium (HNT) is currently trading at $1.455 while seeing a sharp change of 40.21% in 24-hour trading volume.
- 2 HNT price observed a decrease of 2.24% in the last 24 hours.
Helium price is making a bullish double-bottom pattern after taking support from the $1.300. The price may see a further increase in its value if it succeeds in crossing above the current critical resistance levels. The price is at present making an attempt to cross above its recent barrier near 50 EMA. It requires substantial interference from the buyers in order to attain its sizable target.
The technical indicators are presenting a bearish view. The price of HNT is trading below major EMA levels as of now whereas the oscillators are near the overbought levels on the daily timeframe. Though the price pattern holds significance as it is being formed on multiple timeframes and with strong support from buyers it may make further progress.
The current value of HNT is $1.455 (press time) and the coin has a total market cap of 202.27M.
Increase in Bearish Sentiment Among Investors Regarding HNT
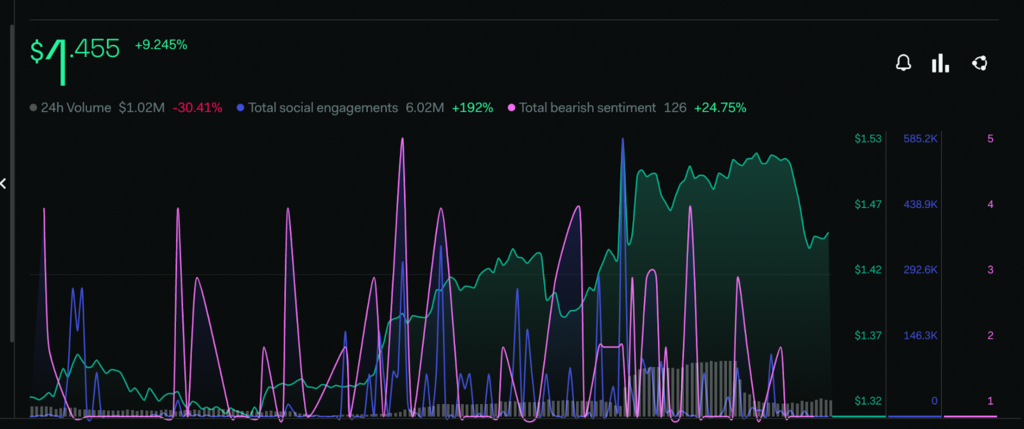
Investors are projecting bearish views regarding the HNT price, as per the metrics provided by LunarCrush there is an increase of -24.75% in the total bearish sentiment of buyers. The Total Social Engagement rate is experiencing a surge of 192% within the last few weeks. Despite an increase in the investors’ bearish sentiments, the price of HNT is trading around a positive pattern.
HNT Price is Making a Double Bottom Pattern on a Daily Time Frame
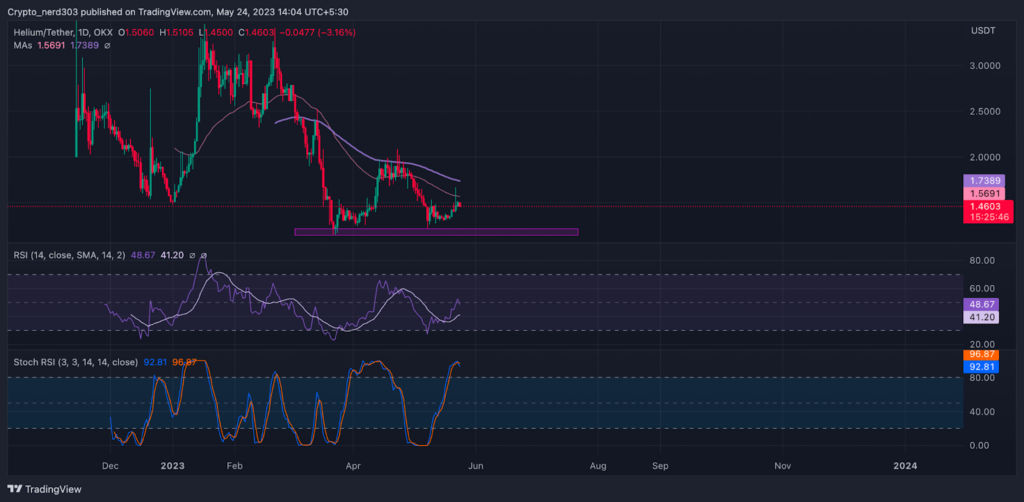
Presently the price is trading under key EMA levels on a one-day chart. It is attempting to make a bullish rebound from the support zone at $1.300 where its next target according to HNT price prediction is $2.000.
The RSI line recently made a positive breakthrough from the 14 SMA points presently it is trading near the median line. The value of RSI at present is 48.67 points whereas the 14 SMA is providing support to it at 41.20 points. The RSI seems to be taking a bullish reversal.
The stochastic RSI is near the overbought levels on the daily timeframe. The %K indicates that it may take a negative reversal moving above the %D line near 80 points. The value of the stochastic RSI at present is 91.42 points.
Conclusion
As of now, according to the analysis, LUNC’s price is making an attempt to break the bear’s hold over it. The price at present is making a W pattern near the demand zone on the long-term timeframes and it may soon breach the neckline of it.
Technical levels –
Support -$1.300
Resistance – $2.000
Disclaimer
The views and opinions stated by the author, or any people named in this article, are for informational purposes only, and they do not establish financial, investment, or other advice. Investing in or trading crypto assets comes with a risk of financial loss.

Andrew is a blockchain developer who developed his interest in cryptocurrencies while pursuing his post-graduation major in blockchain development. He is a keen observer of details and shares his passion for writing, along with coding. His backend knowledge about blockchain helps him give a unique perspective to his writing skills, and a reliable craft at explaining the concepts such as blockchain programming, languages and token minting. He also frequently shares technical details and performance indicators of ICOs and IDOs.


