
 Home
Home News
News

- 1 FTM/USDT is currently trading at $0.3328 while seeing a change in 24 hours of 0.63%.
- 2 The market cap of the FTM coin is $928.23 billion and it has a circulating supply of 2.79B.
Recently, the FTM price broke a major support level on the daily timeframe. The present price action is forecasting an ominous view of the buyers. Previously, after receiving significant support from buyers in early January, the price broke all the major EMA levels and recovered twice its value within a month. After this, the price started making initial signs of a bull trend by making a higher high and low pattern

Presently, It is currently trading below all the major MA and EMA levels. The price will require strong buyer support. After taking a reversal from the current levels with a strong momentum the price may continue its bull trend though that will prove to be extremely challenging as the price recently broke its market structure.

A Fall in Revenue and Fees of FTM Token
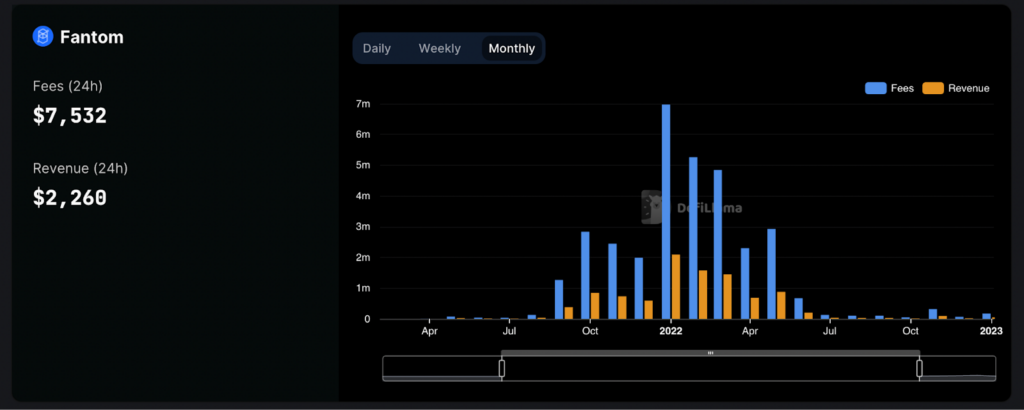
FTM token fees and revenue have declined significantly over the past few months in accordance with the change in TVL. Though it is attempting to recover according to the slight increase in 2023. At present, the fees accumulated by Fantum are $5,658K and the Revenue is $1,698K.
These Metrics indicate that the Investor’s trust in the token is declining. The price of Fantom broke a crucial support level according to the daily chart, hence the chances of a positive recovery appear to be slim.
The FTM Price Fails to Make a Bullish Recovery on the Daily Timeframe
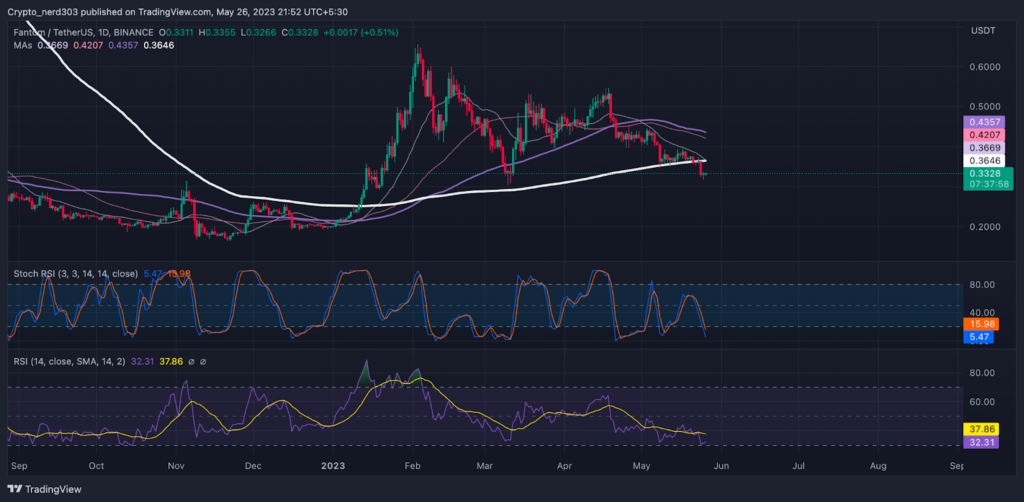
The RSI line is currently attempting to take a positive reversal from 30 points. The current value of RSI is 32.31 points and the current value of the 14 SMA is 37.86 points. The RSI is attempting to make a recovery and may also encourage the buyers to propel the price upward in the near future.
At present, the Stochastic RSI is also following the RSI line. It’s giving a bearish cross-over to the %D line on the daily timeframe. The %K recently is steadily reaching the median line. The current value of Stochastic RSI is 5.47 points.
Conclusion
The majority of the technical indicators are discouraging regarding the trend of FTM tokens. TVL and revenue suggest that investors are not optimistic regarding the long-term perspective of the token as per the DefiLama. The price of FTM has broken a crucial support zone which gives a foreboding sentiment regarding the future trend of the token. Hence, investors may prefer to remain cautious.
Technical levels –
Support –$3.000
Resistance – $5.000
Disclaimer
The views and opinions stated by the author, or any people named in this article, are for informational purposes only, and they do not establish financial, investment, or other advice. Investing in or trading crypto assets comes with a risk of financial loss.

Andrew is a blockchain developer who developed his interest in cryptocurrencies while pursuing his post-graduation major in blockchain development. He is a keen observer of details and shares his passion for writing, along with coding. His backend knowledge about blockchain helps him give a unique perspective to his writing skills, and a reliable craft at explaining the concepts such as blockchain programming, languages and token minting. He also frequently shares technical details and performance indicators of ICOs and IDOs.


