
 Home
Home News
News
- 1 The AAVE price is currently trading at $67.38 near the demand zone.
- 2 The AAVE price observed an increase of 2.74% in the last 24 hours.
The AAVE price is currently making an attempt to recover its previous value. At present the majority of technical indicators are trading in the bear’s favor. Presently major key EMA and SMA levels are providing critical resistance to price. The buyers are currently providing substantial support to the price through the critical resistance levels suggesting that they may face significant resistance in order to be able to attain their target.
A Significant Increase in Social Engagement Levels
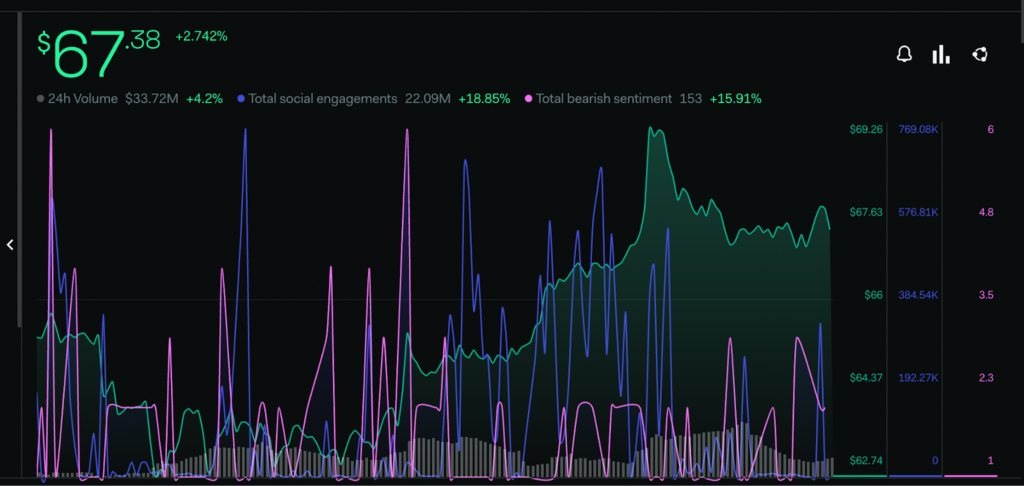
The investor’s sentiments regarding the Avalanche token are presently taking a negative turn. The Total bearish sentiment metrics provided by LunarCrush have declined by 15.91% within the last week despite the bears’ strong presence in price action. The Total Social engagement metrics are observing a critical rise of 18.85%.
Greed and Fear Index of the Major Market Sentiments
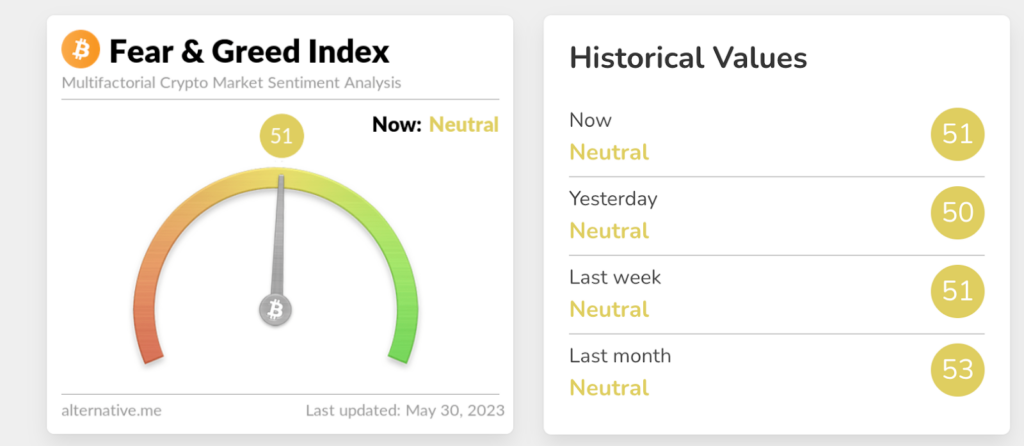
The market sentiments presently are trading near neutral levels at 51 points. The sentiment index is observing a slight decline since the last month when the market was trading at around 53 points, in accordance with the greed and fear index provided by the Alternative(dot)me platform.
A major impact of sellers is observed in most of the cryptocurrency exchange platforms though the buyers are persistent in their attempts to push the price further.
A Decline in TVL and the Price of the AAVE
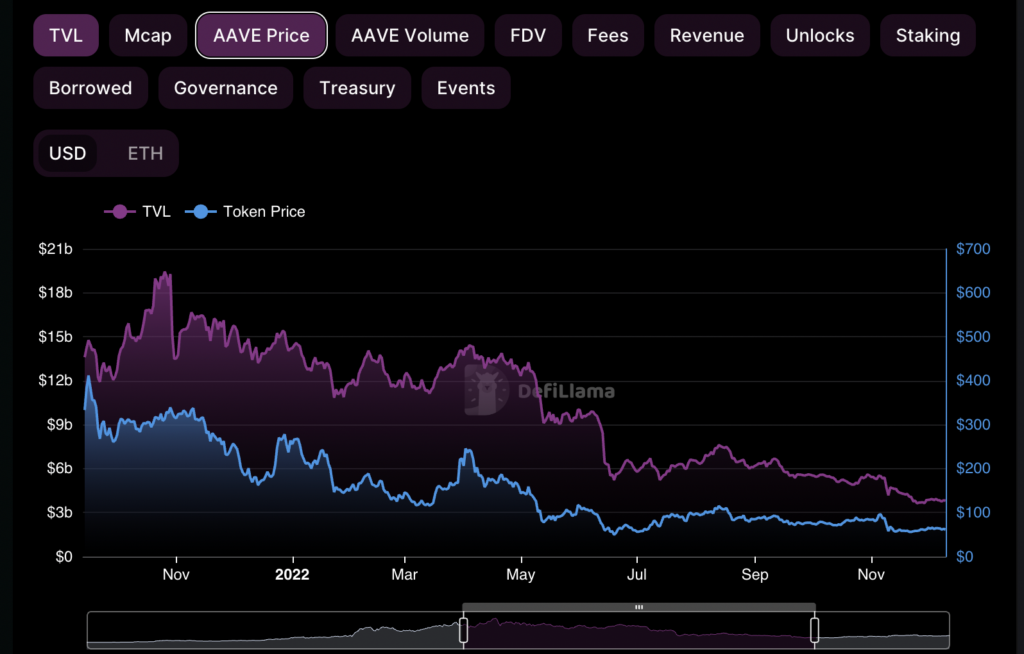
The TVL (Total Value Locked) has declined significantly. The decline in TVL value represents the lack of confidence of the buyers. The present TVL of AAVE is 5.46 Billion, it is observing a substantial change since the last July.
The total fees generated by AAVE is $92.21 Million and the Revenue is $9,29 Million annually.
Technical Analysis (1 Day Timeframe )
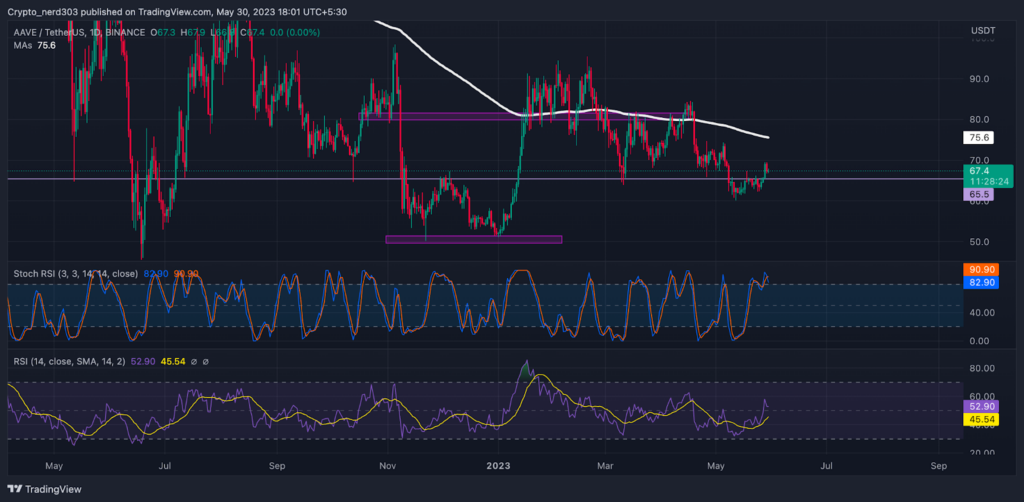
Presently, the RSI line is crossing above the 14 SMA and median lines. The present RSI value is 52.90 and the value of 14 SMA is 45.54 points. The RSI line is suggesting that it may make a correction before continuing the bullish reversal.
In stochastic RSI, the %K line recently took a reversal from the supply zone after making a double top pattern, the %D line is following it closely. Presently the value of the stochastic RSI is 82.90 points on the 1-Day chart.
Conclusion
As per the analysis, the stochastic oscillators are presently taking a bearish turn after trading in the overbought levels for the past few weeks whereas the RSI is making a bullish move.
Technical levels –
Support – $60.00
Resistance – $80.00and $90.00
Disclaimer
The views and opinions stated by the author, or any people named in this article, are for informational purposes only, and they do not establish financial, investment, or other advice. Investing in or trading crypto assets comes with a risk of financial loss.

Andrew is a blockchain developer who developed his interest in cryptocurrencies while pursuing his post-graduation major in blockchain development. He is a keen observer of details and shares his passion for writing, along with coding. His backend knowledge about blockchain helps him give a unique perspective to his writing skills, and a reliable craft at explaining the concepts such as blockchain programming, languages and token minting. He also frequently shares technical details and performance indicators of ICOs and IDOs.


