
 Home
Home News
News
- 1 EGLD’s price is currently trading at $37.46 while recording a 6.02% drop in its 24-hour trading volume.
- 2 EGLD price is recording a fall of 5.55% within the last 24 hours.
Presently the price of EGLD is attempting to make a positive breakout after seeing a bearish decline in the daily timeframe. The price is observing an increase in the selling pressure though It has been making spinning tops and doji candlestick patterns, which denotes the exhaustion in the market. If the price succeeds in making the breakout above the previous support level, it can see a positive increase in its value.
The oscillators present contrasting views, where the stochastic RSI has reached the oversold levels of the RSI line trading near the median line. The price has been respecting the 200 EMA constantly for the past few months. The price must breach multiple significant resistance levels to attain its target.
EGLD Price Sees a Decline in the Bearish Sentiment of Investors
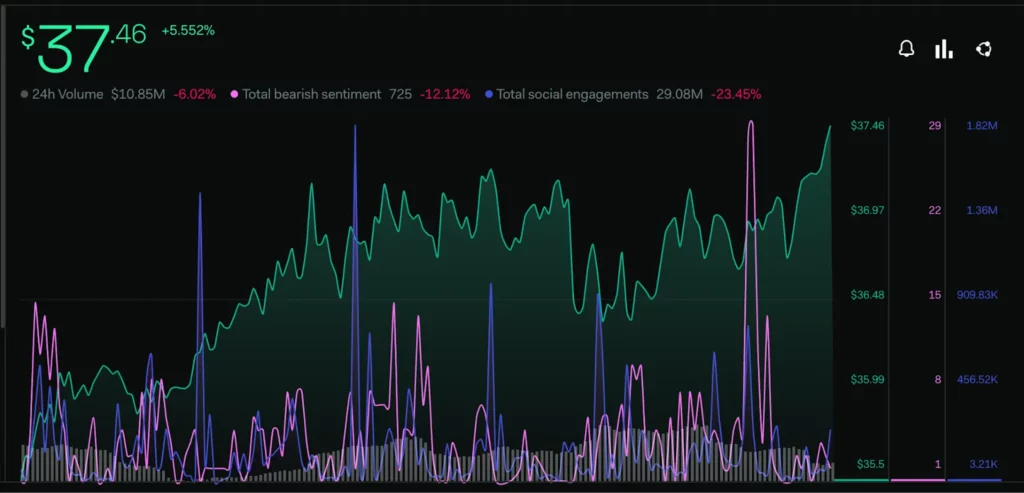
The investor’s opinion regarding the EGLD price is observing a decline in bearish sentiments. Total bearish sentiment metrics have decreased by -12.12%, whereas the total engagement levels among the investors have declined by 23.45%, According to LunarCrush.
A positive increase is also observed in the YouTube volume of 42.1%, which suggests that the community is getting more engaged regarding the token.
The previous analysis predicted that after taking rejection from 200 EMA near early May, the price was expected to decline its value further. It was trading near $39.21, The analysis was supported by multiple technical indicators on the daily timeframe. The forecast was proven correct when after breaking the nearest support level, it saw a 10% downfall.
Technical Analysis (1-Day Timeframe)
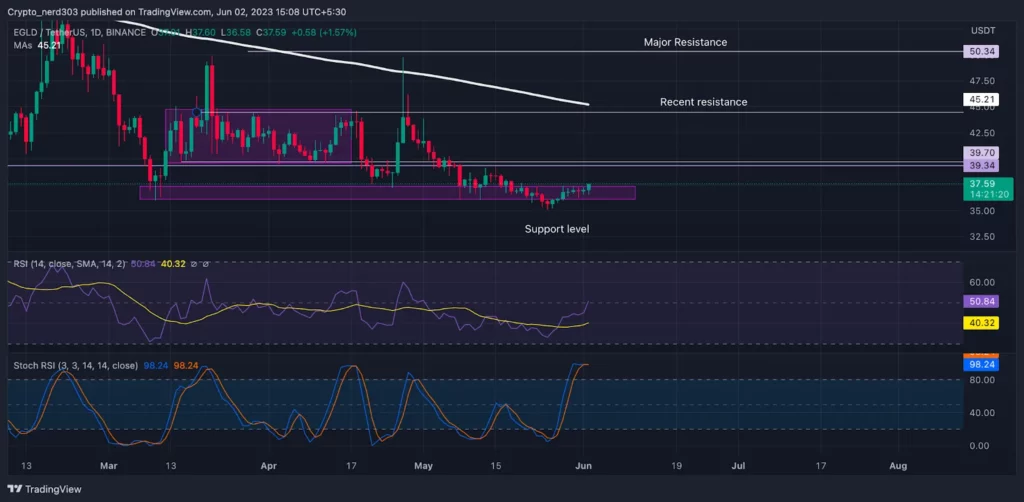
The RSI line gives a positive crossover to the median line and on the daily timeframe. The current value of the RSI is 50.84 points, whereas the 14 SMA is trading at 40.32 points. The RSI line is steadily moving toward the oversold levels suggesting that the price may take its lead.
The stochastic RSI is trading at the overbought level of 95.24 points. The present situation is projecting a bullish perspective, although the stochastic RSI trades near the oversold zone.
Conclusion
Our analysts say the price is preparing to make a bullish breakout. It is at present making a bullish candle which may prove to be a positive indication regarding the future. The price of EGLD is predicted to see an increase in its value if it gains the buyer’s attention
Technical levels –
Support -$35.00
Resistance – $40.00 and $45.00
Disclaimer
The views and opinions stated by the author, or any people named in this article, are for informational purposes only and do not establish financial, investment, or other advice. Investing in or trading crypto assets comes with a risk of financial loss.

With a background in journalism, Ritika Sharma has worked with many reputed media firms focusing on general news such as politics and crime. She joined The Coin Republic as a reporter for crypto, and found a great passion for cryptocurrency, Web3, NFTs and other digital assets. She spends a lot of time researching and delving deeper into these concepts around the clock, and is a strong advocate for women in STEM.


