
 Home
Home News
News
- 1 The price of FXS is currently trading at $5.001 where it is undergoing a change of 25.42% in the 24-hour trading volume.
- 2 The FXS price has declined by 18.25% in the last 24 hours.
The price of the FXS token is observing a sharp decline in its value after breaking the support level. It is making a red engulfing candle on the daily time frame which overshadows all the previous candles signifying the strength of bears’ control over the price.
The FXS coin is currently trading 12% above its recent resistance level on the daily time frame. According to the historical price action, FXS coin has been constantly retesting the support zone hence it can be estimated that the price may come back for a retest in the near future seeing a further decline in its value.
The major cryptocurrencies recently took a sudden plunge in the last few weeks. However, as they have reached their long-term support levels, it can create a bullish impact on the overall market.
The value of the token is momentarily undervalued as per the oscillators which may prompt more buyers to step into the price action.
Investors Regaining Confidence In Price
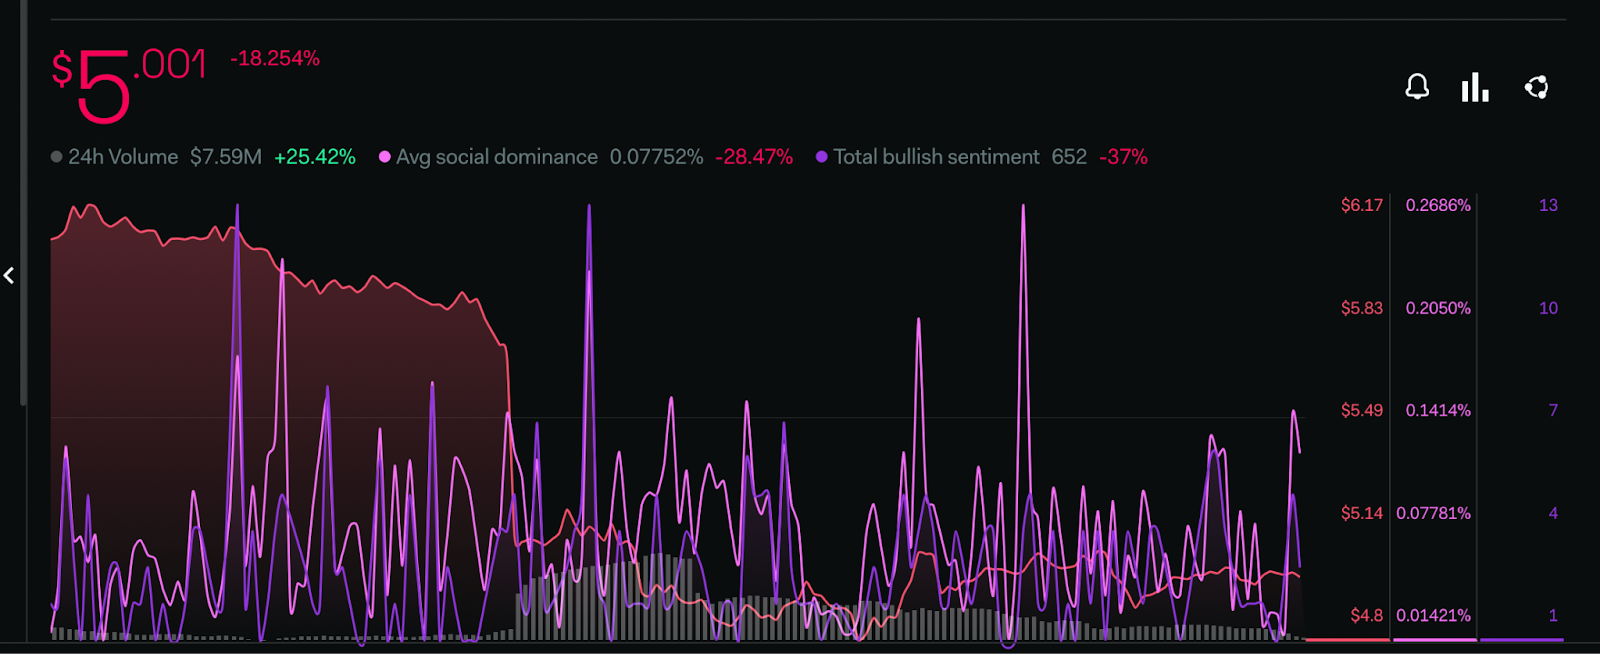
According to LunarCrush, the total bullish sentiment metric of buyers has declined by 37%. There is a positive surge in the 24-hour trading volume of the token of 25.42% indicating an increase in the buying and selling activity of the token.
Technical Analysis of FXS Price on Daily Chart
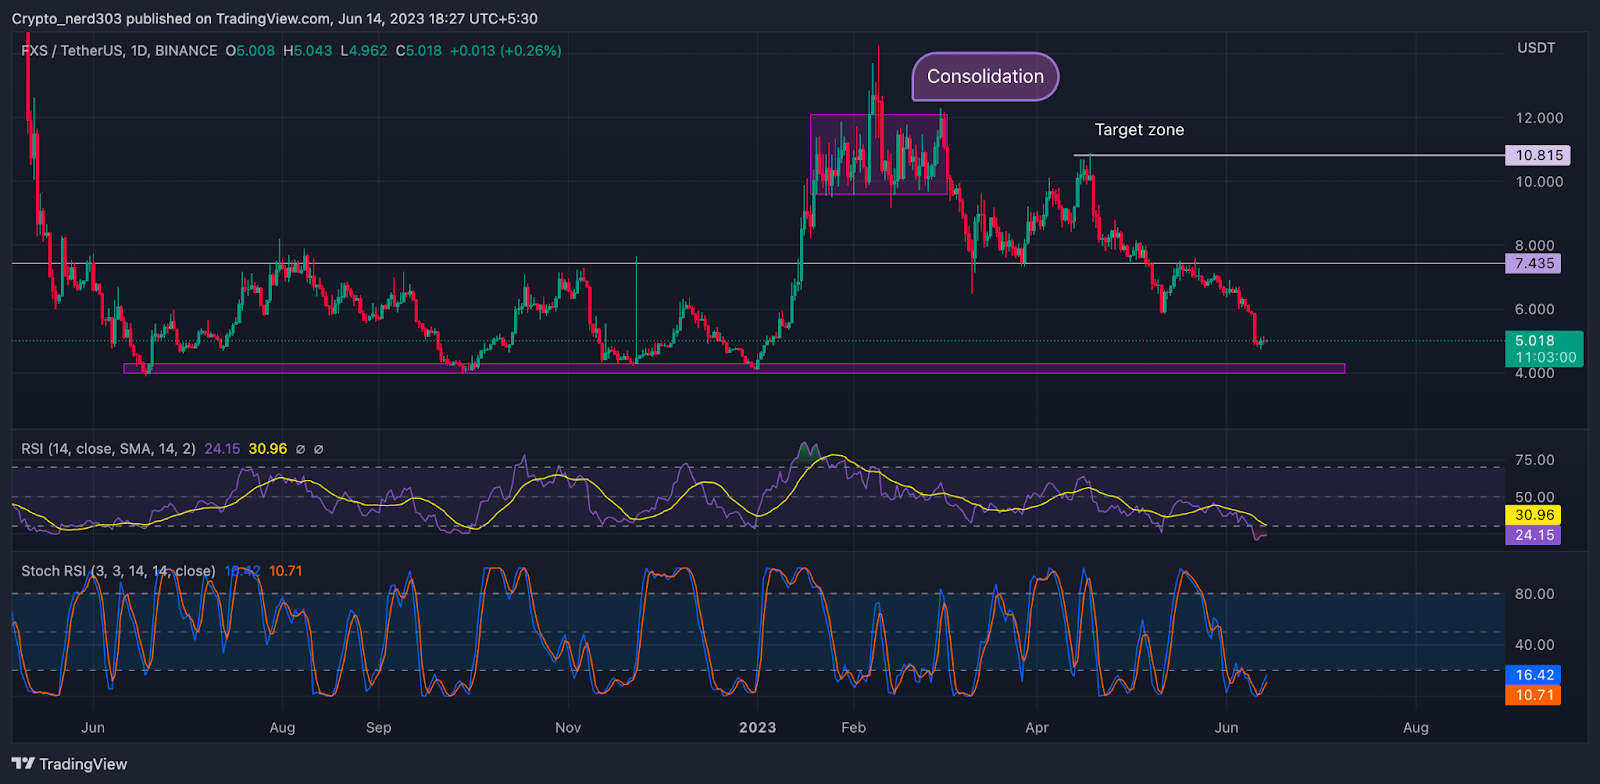
The price of FXS is trading below all the primary 20/50/100/200 EMA levels which implies that it is in a significant downtrend. The sellers have considerable influence over the price action which may prove to be challenging for the bulls to break.
The RSI value is 24.15 points and it is facing resistance from the 14 SMA, which is trending just below its oversold zone. The RSI line is at around 30.96 near the demand level.
The stochastic RSI is moving on the RSI’s lead making a double bottom pattern. The %K and %D lines are giving positive interception near oversold levels, and the current value of the stochastic RSI is 16.42 points.
Conclusion
According to the analysis, The FXS coin is currently trading 12% above its recent resistance level on the daily timeframe. The value of the token is presently undervalued according to the oscillators and this may encourage more buyers to step into the market.
Technical Levels:
Support – $4.000
Resistance – $8.000
Disclaimer
The views and opinions stated by the author, or any people named in this article, are for informational purposes only, and they do not establish financial, investment, or other advice. Investing in or trading crypto assets comes with a risk of financial loss.

Andrew is a blockchain developer who developed his interest in cryptocurrencies while pursuing his post-graduation major in blockchain development. He is a keen observer of details and shares his passion for writing, along with coding. His backend knowledge about blockchain helps him give a unique perspective to his writing skills, and a reliable craft at explaining the concepts such as blockchain programming, languages and token minting. He also frequently shares technical details and performance indicators of ICOs and IDOs.


