
 Home
Home News
News
- 1 Icon Price is currently trading at $0.1736 while witnessing a decrease of 1.36% during the intraday session.
- 2 ICX price trades below 20, 50,100 and 200-day EMAs.
- 3 The year to date return of Icon is 24.08% while three month return of Icon is -14.99%.
ICX is a native token of the Icon network. ICX is a prominent project which allows separate blockchains to exchange data with each other.
Icon has been witnessing a bearish trend after an annual high at $0.4887 on April 5, 2023. The positive sentiment during the start of the year around the crypto market pushed the price upward from the low of $0.14.

The bullish rally for Icon price led to the formation of an annual high, after which it has been in a bearish trend. The price attempted to retest the annual highs, establishing support at the $0.2950 level; however, its progress halted at the $0.3934 level.
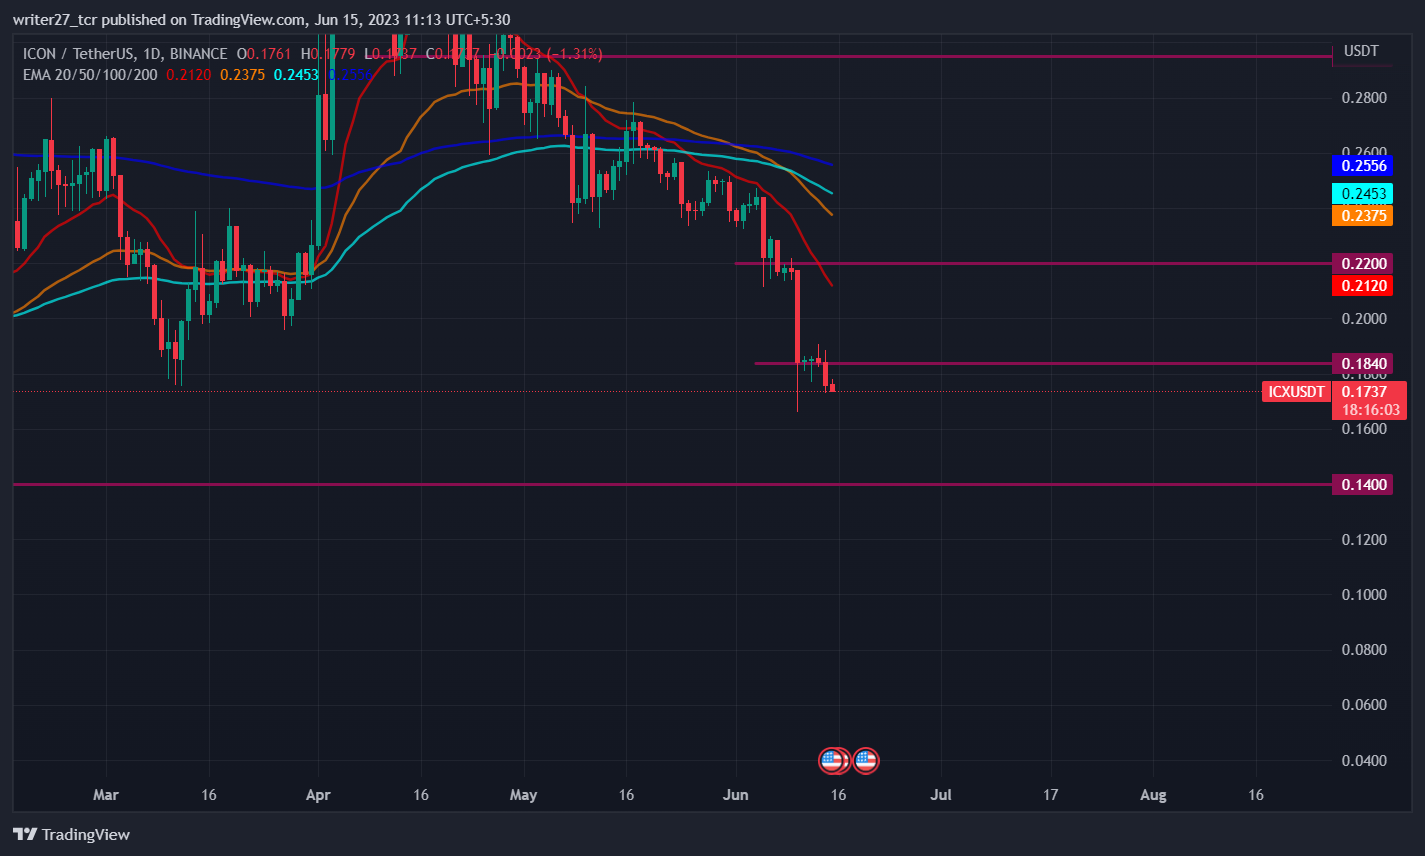
Recently, ICX price established a support level at $0.1840 and the previous day’s candle gained enough bearish momentum to shatter the support level. Currently, the price is headed toward the yearly lows and the major support level of $0.14.
Moves That Might Play Out For Icon Price
If the current candle gains bearish momentum and breaks the lower wick of the previous candle, there is high probability for the price to head toward the $0.14 level. To halt the bearish momentum, ICX price needs to form a support level and should stay above the $0.16 level.
Will ICX Price Further Decline To $0.14 Level?
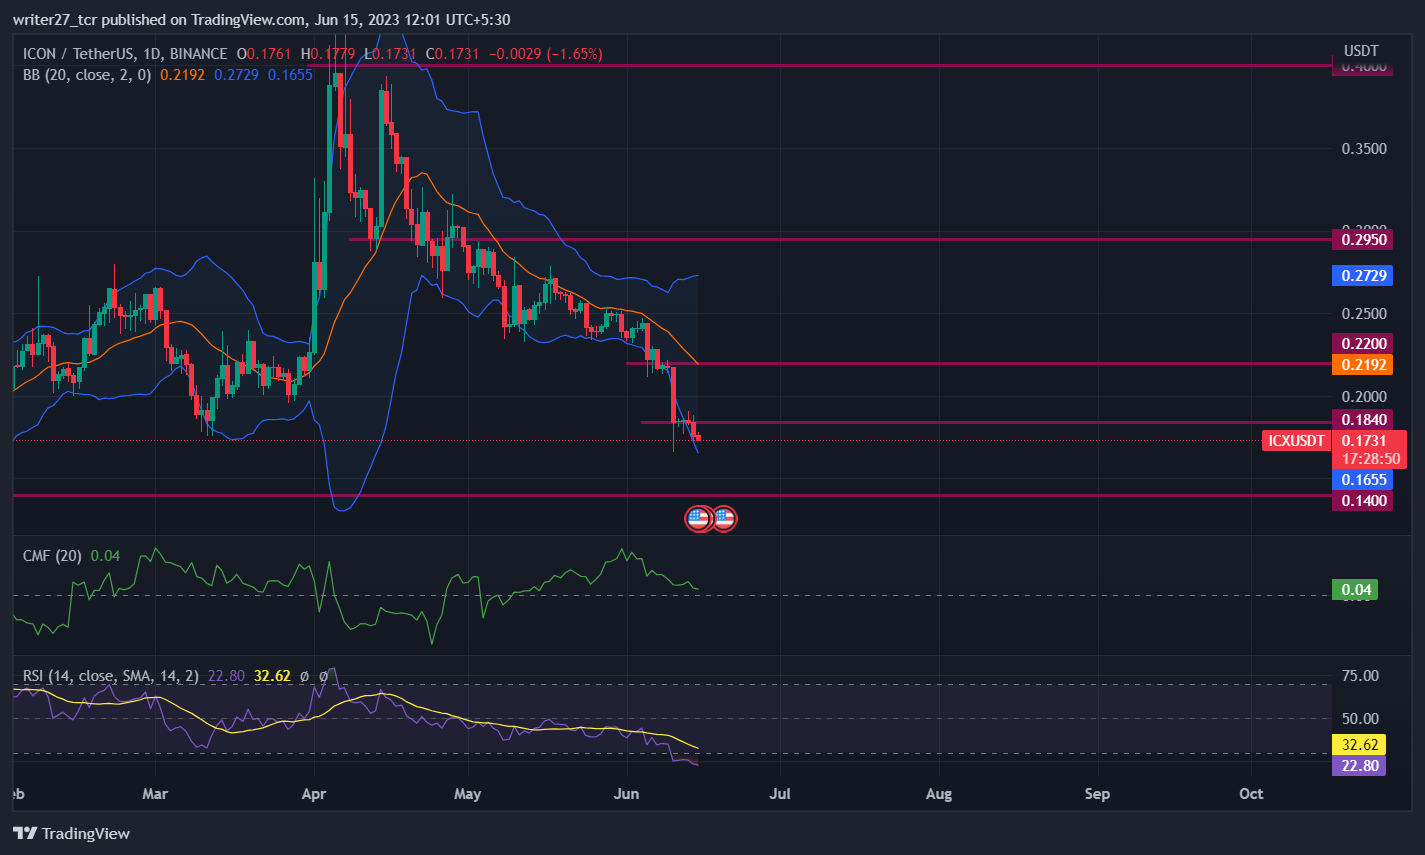
ICX is trading below 20,50,100 and 200-Day EMAs, indicating bearish momentum in the price. Although price indicates a bearish trend, chaikin money flow score is still in positive territory. The CMF is currently at 0.04 indicating that buyers are still active in the market. The relative strength index has been residing in the oversold zone since June 10.
The current trading price of RSI stands at 22.90, indicating a potential reversal; however, this seems unlikely given the prevailing bearish momentum. It is more probable that the price will experience a retracement followed by a further decline. Meanwhile, ICX price has recently reached the lower band of the Bollinger indicator but has yet to exhibit any indications of a pullback. In this case, it is possible that the cryptocurrency’s price will retrace towards the 20-day Simple Moving Average (SMA) of the Bollinger bands.
The long/short ratio of ICX is 0.86 with 46.39% longs and 52.61% shorts, indicating increased pressure from the seller side in the last 24 hours.
Conclusion
The market structure and price action of Icon is bearish. ICX price needs to form a support level in order to prevent price from further downfall. The technical indicators are favoring the selling side due to strong bearish momentum.
RSI and bollinger bands are in favor of reversal but there are no signs of bullishness in the market. As Bitcoin has been shattering some of the major support levels, all of the altcoins have been following in Bitcoin’s footsteps.
Technical Levels
Major support: $0.14 and $0.11
Major resistance: $0.184 and $0.22
Disclaimer
The views and opinions stated by the author, or any people named in this article, are for informational purposes only. They do not establish financial, investment, or other advice. Investing in or trading crypto assets comes with a risk of financial loss.

Andrew is a blockchain developer who developed his interest in cryptocurrencies while pursuing his post-graduation major in blockchain development. He is a keen observer of details and shares his passion for writing, along with coding. His backend knowledge about blockchain helps him give a unique perspective to his writing skills, and a reliable craft at explaining the concepts such as blockchain programming, languages and token minting. He also frequently shares technical details and performance indicators of ICOs and IDOs.


