
 Home
Home News
News

- 1 MANA is currently trading at $0.3294.
- 2 The MANA price recorded a decline of 21% in the last 7 days.
The MANA price recently broke its crucial support level on the daily timeframe. The price action signifies that the sellers are presently active and hold prominence when it comes to MANA tokens. As the value of the MANA token is breaching its important support level, there is a strong possibility that it may see a further fall in its value.
The oscillators RSI and stochastic RSI at present are trading around severe demand levels. The price of MANA at present is observing a severe decline in its value of 32% within the last 7 days. The majority of the technical indicators and price action present a possibility of recovery.

The current value of the MANA token is $0.3294 and it has a market cap of $617.69 Million.
Bearish Permaters In LunarCrush Regarding MANA Price
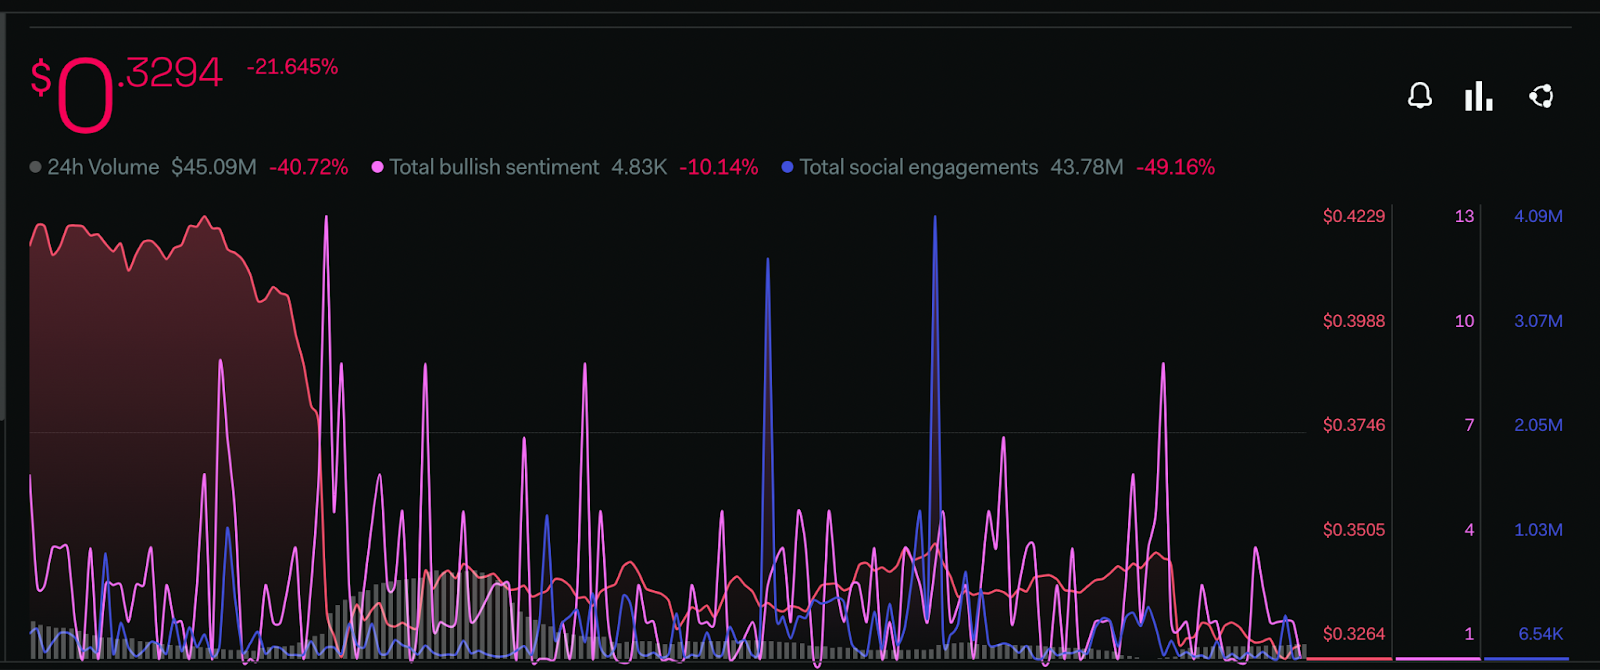
According to LunarCrush, Investors are witnessing a fall in bullish sentiments within the past few days regarding MANA price. The total bullish sentiment metric has depreciated by 10.14%.
There is a drop of 49.16% over the previous few days in total social engagement levels.
Greed and Fear Index of the Investor’s Opinions
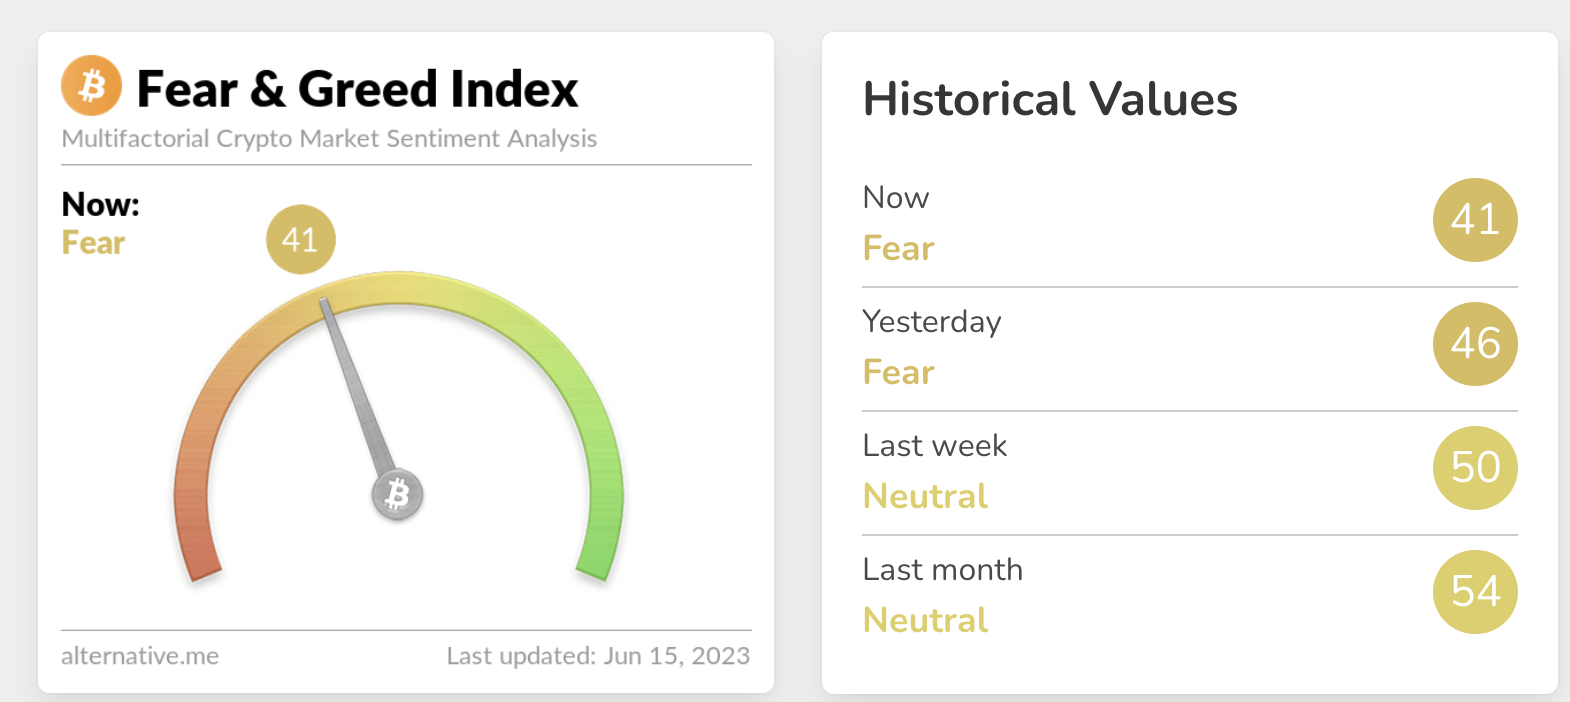
The sentiments of the investors are presently taking a bearish fall in the fear zone according to the greed and fear index. The majority of market sentiments are observing a fall of 10 points in the last few weeks, the sentiments are shifting from greed to fear zone In accordance with the greed and fear index, provided by the Alternative (dot) me platform.
The bears are presently gaining prominence in the price action.
Technical Analysis of MANA Price On Daily Chart
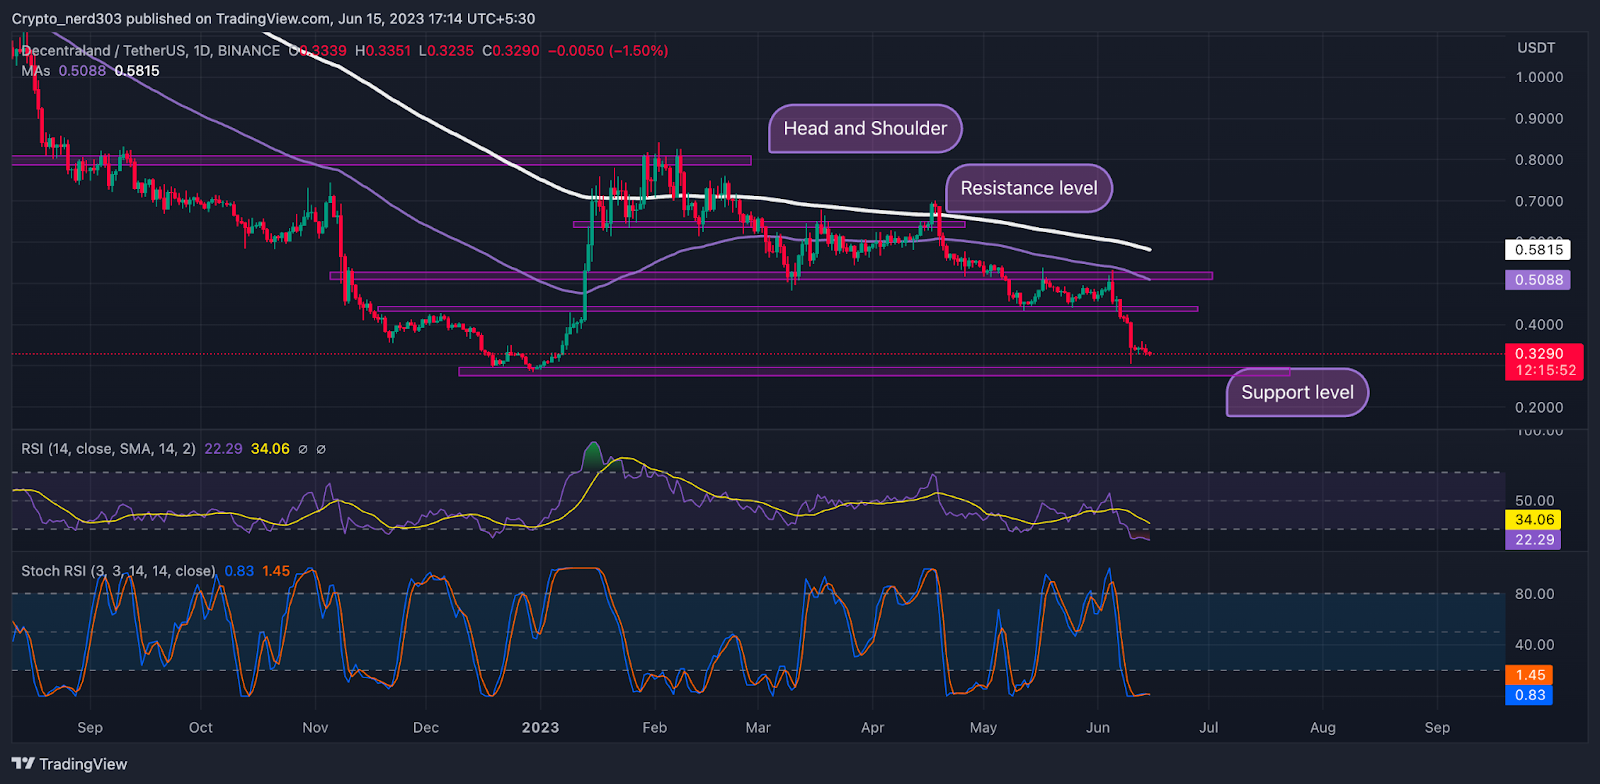
The RSI line is consolidating near the oversold zone after providing an adverse interception to 14 SMA and the 30 RSI line on the daily chart. Presently, the RSI line is trading at 22.29 points, whereas the 14 SMA is trending just above it at around 34.06 points.
The stochastic RSI has been moving near its extreme oversold rate with the RSI line. The %K line may shortly give an interception to the %D line close to 14 points; the value of the stochastic RSI is 0.83 points.
Conclusion
According to the analysis, the sellers are presently active and hold prominence when it comes to MANA tokens.
Technical Levels:
Support –$0.2000
Resistance – $0.4000
Disclaimer:
The views and opinions stated by the author, or any people named in this article, are for informational purposes only, and they do not establish financial, investment, or other advice. Investing in or trading crypto assets comes with a risk of financial loss.

Andrew is a blockchain developer who developed his interest in cryptocurrencies while pursuing his post-graduation major in blockchain development. He is a keen observer of details and shares his passion for writing, along with coding. His backend knowledge about blockchain helps him give a unique perspective to his writing skills, and a reliable craft at explaining the concepts such as blockchain programming, languages and token minting. He also frequently shares technical details and performance indicators of ICOs and IDOs.


