
 Home
Home News
News

- 1 QTUM price is currently trading at $2.037 with a 3.3% gain in the 24-hour trading volume.
- 2 QTUM price is down by 13.74% in the last 7 days on the daily chart.
There is a sensation of fear observed among the investors for the past few weeks. Recently, prominent cryptocurrencies made a breakdown through crucial support levels seeing a fall of 7% with a bearish momentum which appears to be impacting the overall market. QTUM price is observing a decline of 18.92% after breaking a crucial support level.
QTUM price is presently following the majority of the market. Presently, the price is trading under the 200 EMA support zone at the daily time frame. The price action suggests that the value of the QTUM token can see a further decline in its value as the market structure is currently in the middle of a bearish correction.

Presently, the value of the QTUM token is $0.447 and it has a market cap of $657.88 Million.
Investors Showing Bullish Optimism
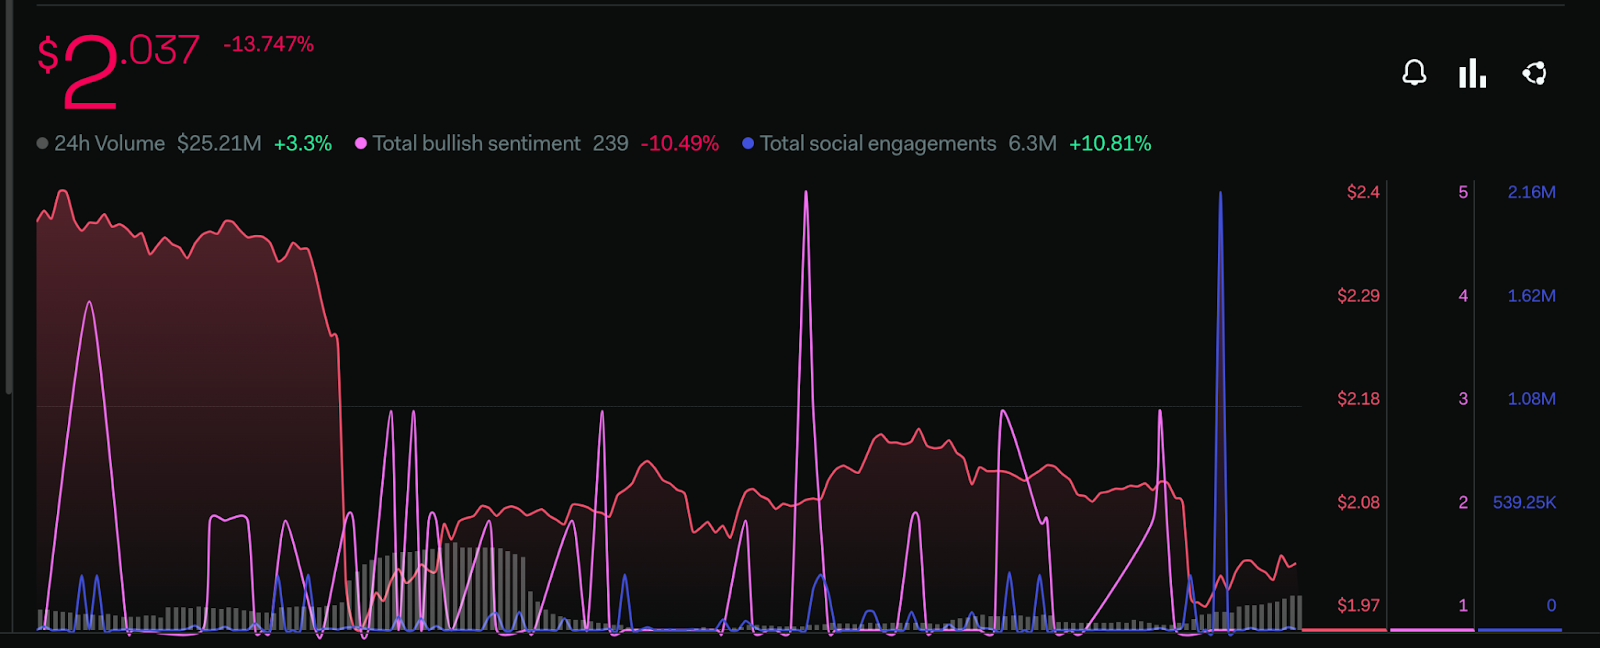
According to LunarCrush, the investors are not very optimistic regarding the recovery of the token though their perspective may change once the price approaches the support zone. The total bullish sentiment parameter has depreciated by 10.49%, whereas the total social engagement metrics are seeing a positive surge of 10.81% indicating that not many investors are engaged concerning the token across various social media platforms.
The 24-hour trading volume is observing a slight appreciation of 3.3% within the last few weeks.
Technical Analysis of QTUM Price On Daily Chart
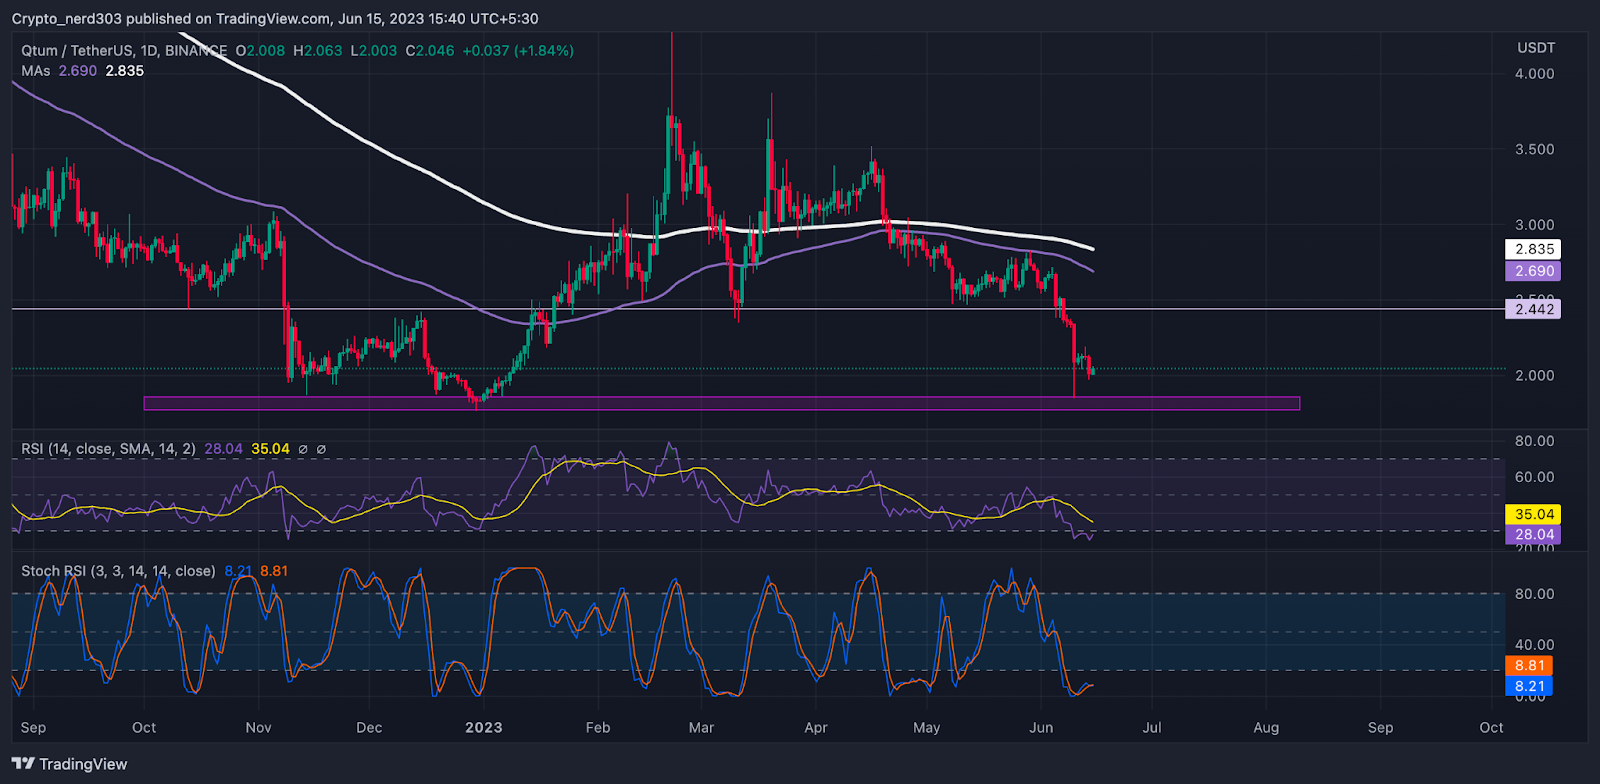
The RSI line is presently moving near the undersold level on the daily timeframe. The RSI line is moving near 28.04 points and the 14 SMA is providing resistance to it at around 34.04 points. The RSI line indicates that the price of the QTUM token may soon attempt to make a positive
Stochastic RSI recently bullish crossover between the %D and %K lines though it is yet to intercept the 20 RSI zone. The present value of stochastic RSI is 8.21 points.
Conclusion
The price of QTUM is presently taking divergence from the major EMA levels. Observing historical chart patterns it can be estimated that the price always comes for a retest from the EMA levels. The oscillators are currently indicating that the price is undervalued. The investors are not very optimistic regarding the recovery of the token.
Technical levels
Support – $1.500 and $1.000
Resistance – $2.500 and $3.000
Disclaimer
The views and opinions stated by the author, or any people named in this article, are for informational purposes only, and they do not establish financial, investment, or other advice. Investing in or trading crypto assets comes with a risk of financial loss.

Andrew is a blockchain developer who developed his interest in cryptocurrencies while pursuing his post-graduation major in blockchain development. He is a keen observer of details and shares his passion for writing, along with coding. His backend knowledge about blockchain helps him give a unique perspective to his writing skills, and a reliable craft at explaining the concepts such as blockchain programming, languages and token minting. He also frequently shares technical details and performance indicators of ICOs and IDOs.


