
 Home
Home News
News
- 1 STX price is currently trading at $0.477 with a 19% gain in the 24-hour trading volume.
- 2 STX price is down by 27% in the last 7 days on the daily chart.
Currently, the price is trading below the 200 EMA support zone at the daily time frame. Despite several attempts by the bulls to maintain the price above the support level, it is currently observing a severe surge in selling pressure. STX price is presently following the majority of the market.
The major cryptocurrencies recently broke a major support level with a major bearish momentum which seems to be impacting the overall market. However, STX is steadily reaching its next support level which may prompt the buyers to step into action.

The price of STX recently saw a fall of 24% within a short period, and it currently displays a bearish red candle which suggests a strong presence of buyers in the market. If investors show their support at the recent price levels, there is a remote probability that the price may make a bullish recovery within the next few weeks.
Presently, the value of the STX token is $0.447 and it has a market cap of $657.88 Million.
Investors Showing Bullish Optimism
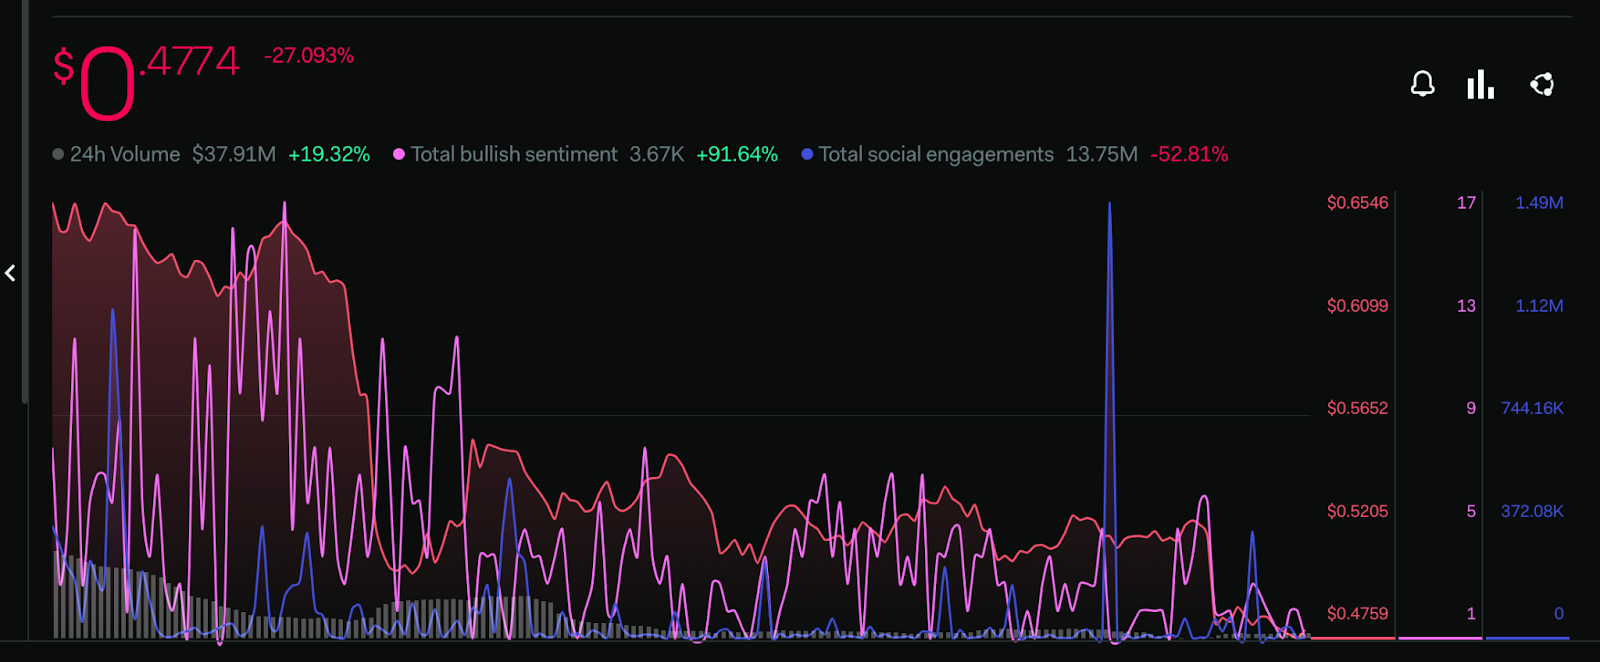
According to LunarCrush, the investors’ sentiments regarding the current market indicate an optimistic turn. The total bullish sentiment parameter has appreciated by 91.64%, whereas the total social engagement metrics are seeing a bearish decline of 52.81% indicating that not many investors are engaged concerning the token across diverse social media platforms.
The 24-hour trading volume has surged slightly by 19.13%, indicating that the token is being exchanged between the buyers and sellers actively.
Technical Analysis of STX Price on Daily Chart
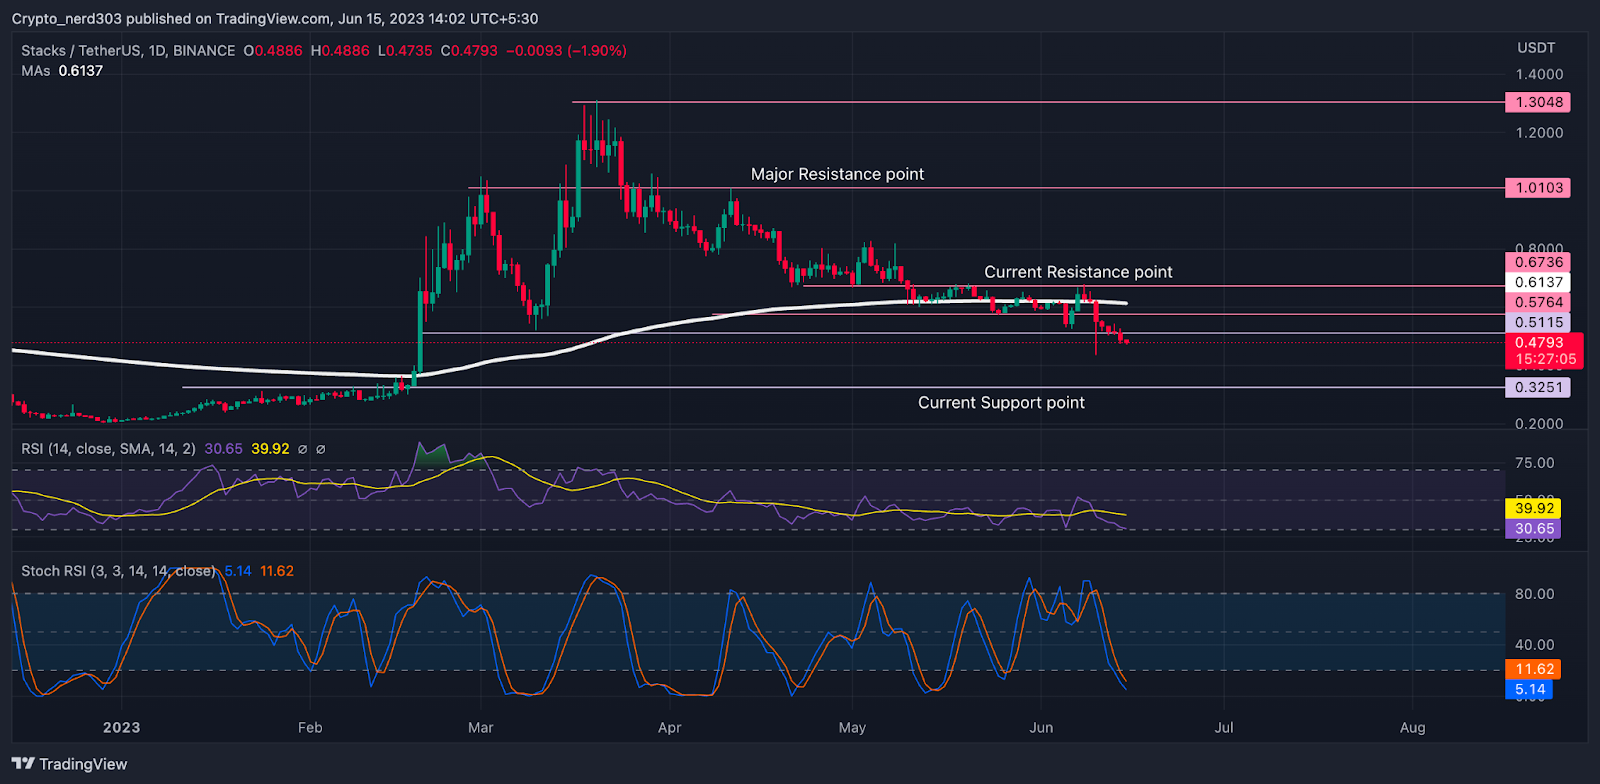
The RSI line is presently attempting to make a positive recovery from the undersold level SMA. The RSI line is moving near 30.65 points and the 14 SMA is providing resistance to it at around 39.92 points.
Stochastic RSI may soon give a bullish crossover between the %D and %K lines. The present value of stochastic RSI is 5.14 points.
Conclusion
The price of STX is presently moving below the primary EMA and MA levels. The oscillators are currently indicating a recovery from the demand zone. However, investors’ sentiments may soon start reflecting on the price albeit after a correction.
Technical levels
Support – $3.000 and $2.000
Resistance – $8.000 and $6.000
Disclaimer
The views and opinions stated by the author, or any people named in this article, are for informational purposes only, and they do not establish financial, investment, or other advice. Investing in or trading crypto assets comes with a risk of financial loss.

Andrew is a blockchain developer who developed his interest in cryptocurrencies while pursuing his post-graduation major in blockchain development. He is a keen observer of details and shares his passion for writing, along with coding. His backend knowledge about blockchain helps him give a unique perspective to his writing skills, and a reliable craft at explaining the concepts such as blockchain programming, languages and token minting. He also frequently shares technical details and performance indicators of ICOs and IDOs.


