
 Home
Home News
News
- 1 Dydx price is trading at $1.72 with an increase of 1.83% during the intraday session.
- 2 Dydx price trades below 20,50,100 and 200-day EMAs.
- 3 The year to date return of Dydx is 57.03% while three month return is -34.86%.
The bullish rally for Dydx price began at the starting of 2023 when price started to rise from the low of $1.08. The move led to formation of annual high at $3.674 since then price has not shown any major moves. Dydx price tried to retest the yearly high but could rise above $3.24 level.
Recently, the price was stuck in a consolidation zone ranging between $1.96 and $2.24 in the month of May. As negative sentiment started to rise in June, Dydx price finally did a breakout from the consolidation zone and fell downward to form a support near $1.55.
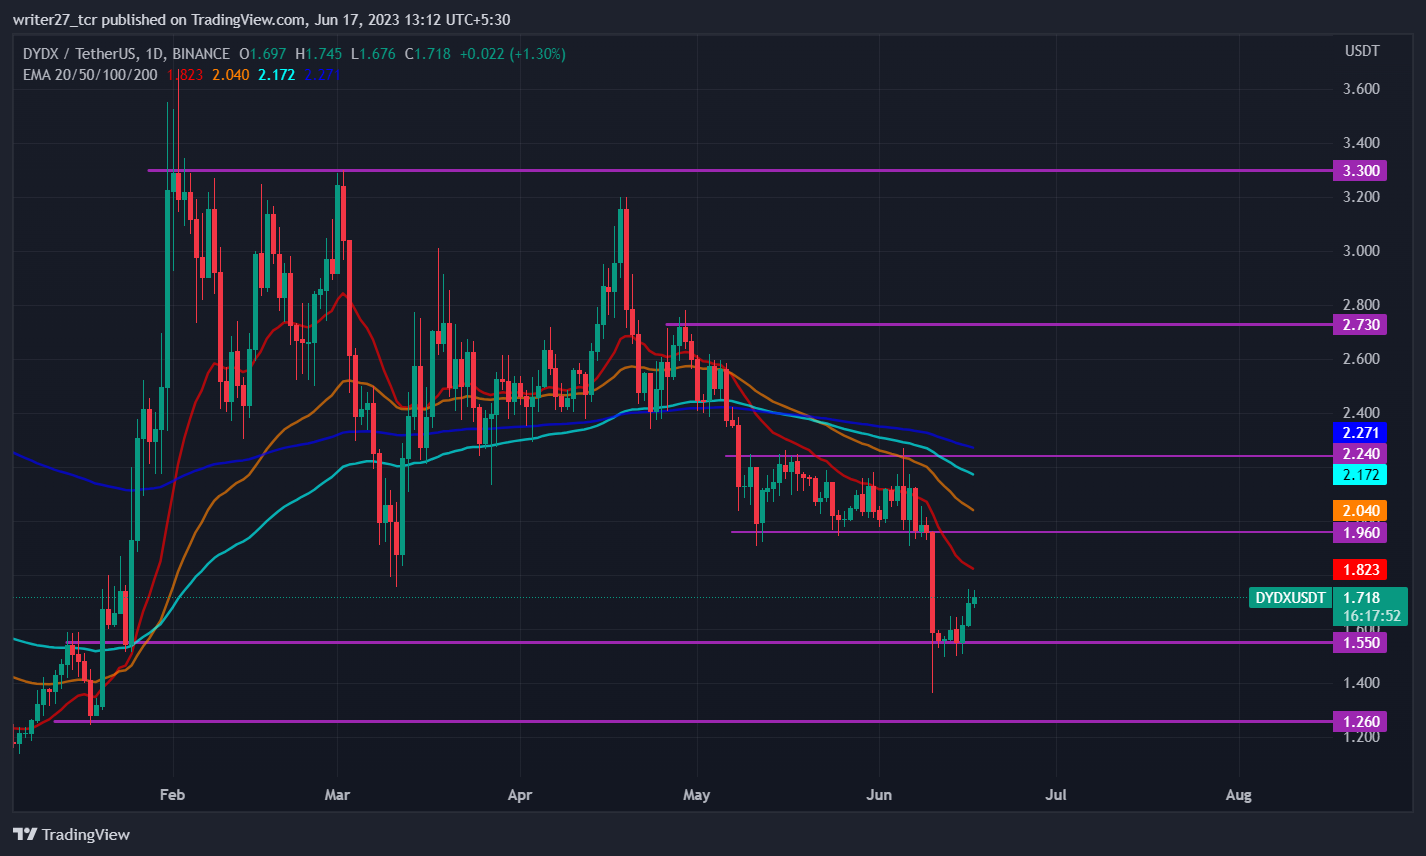
Currently, the crypto currency price has started to show positive sentiment and is trying to recover from the losses which occurred during the starting of June. Price is currently headed toward the recent support turned resistance level of $1.96 level.
Positive OutLook For Dydx
The market leader bitcoin and ethereum have also started to gain bullish momentum and BTC price has risen above $26,000 which has induced positive sentiment in the altcoins. The token has also gained interest of investors as the United States Securities and Exchange Commission (SEC) filed a lawsuit against a major crypto currency exchange.
For the price to regain bullish momentum, it needs to stay above the recent support and rise above the major resistance level of $2.73 level for retesting the annual high. This move would push price above all the major EMAs which will lead to trend shift. On the other hand, if bears can shatter the recent support, Dydx price might fall toward the $1.26 which would cause a downfall of approximately 17%.
WIll Dydx Price Sustain Bullish Momentum?
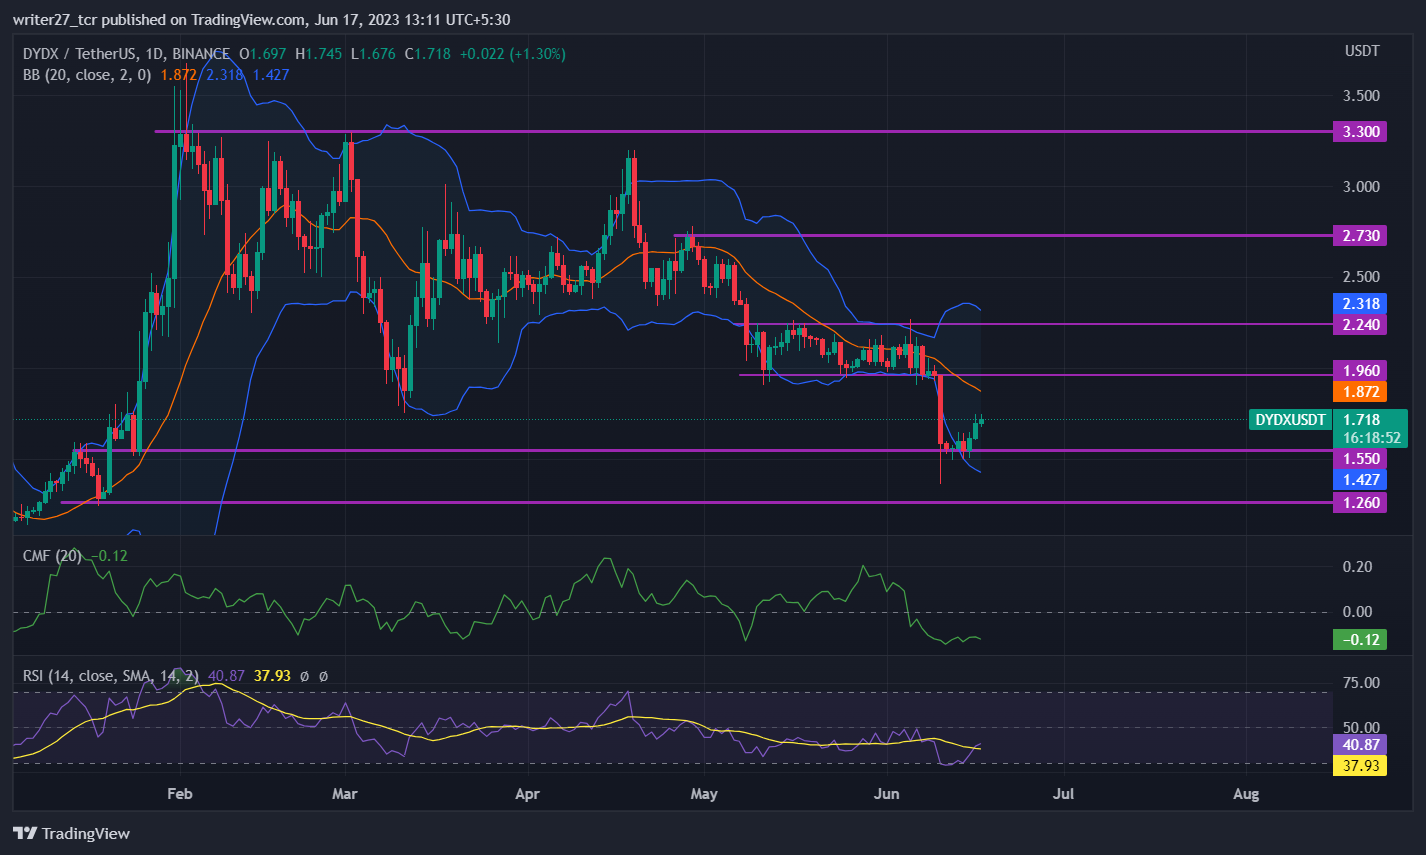
The chaikin money flow score is -0.12 which indicates that there is weakness in the market. RSI started to rise after touching the oversold zone and is currently at 41.34 indicating rising positive sentiment in the market. Dydx price is trading below 20,50,100 and 200-day EMAs indicating bearish momentum in the price.
If RSI rises above 55 mark, it would confirm that price is gaining bullish momentum. Dydx price reached the lower band of the bollinger and started to rise toward the upper band of bollinger. The long/short ratio of Dydx is 1.08 with 52.13% longs and 47.87% shorts indicating increased participation of buyers in the market.
Conclusion
The market structure and price action has turned bullish as bitcoin and ethereum have started to rise. The altcoins have started to gain investors’ interest. The technical parameters are suggesting that there is increased participation of buyers in the market. Traders should wait for proper confirmation before looking for bids as this move might just be a short term pullback.
Technical levels
Major support: $1.26 and $1
Major resistance: $2.40 and $2.73
Disclaimer
The views and opinions stated by the author, or any people named in this article, are for informational purposes only. They do not establish financial, investment, or other advice. Investing in or trading crypto assets comes with a risk of financial loss.

Andrew is a blockchain developer who developed his interest in cryptocurrencies while pursuing his post-graduation major in blockchain development. He is a keen observer of details and shares his passion for writing, along with coding. His backend knowledge about blockchain helps him give a unique perspective to his writing skills, and a reliable craft at explaining the concepts such as blockchain programming, languages and token minting. He also frequently shares technical details and performance indicators of ICOs and IDOs.


