
 Home
Home News
News

- 1 DOGE price is currently trading at $0.0619 while seeing a change of -46% in 24-hour trading volume.
- 2 DOGE is up by -0.23% in the last 24 hours.
The DOGE price recently broke its trendline with a red engulfing candle which was being defended by the Buyers for the past 13 months. It is currently moving within a consolidation phase on the daily timeframe. The current price action indicates that the price of the DOGE token may change the trend if it fails to take a retest which often occurs when a current trend is broken.
The current value of the DOGE coin is $0.0619, it has a total Market Cap of $8.66 Billion.

An Increase in Bearish Pessimism in the DOGE Price
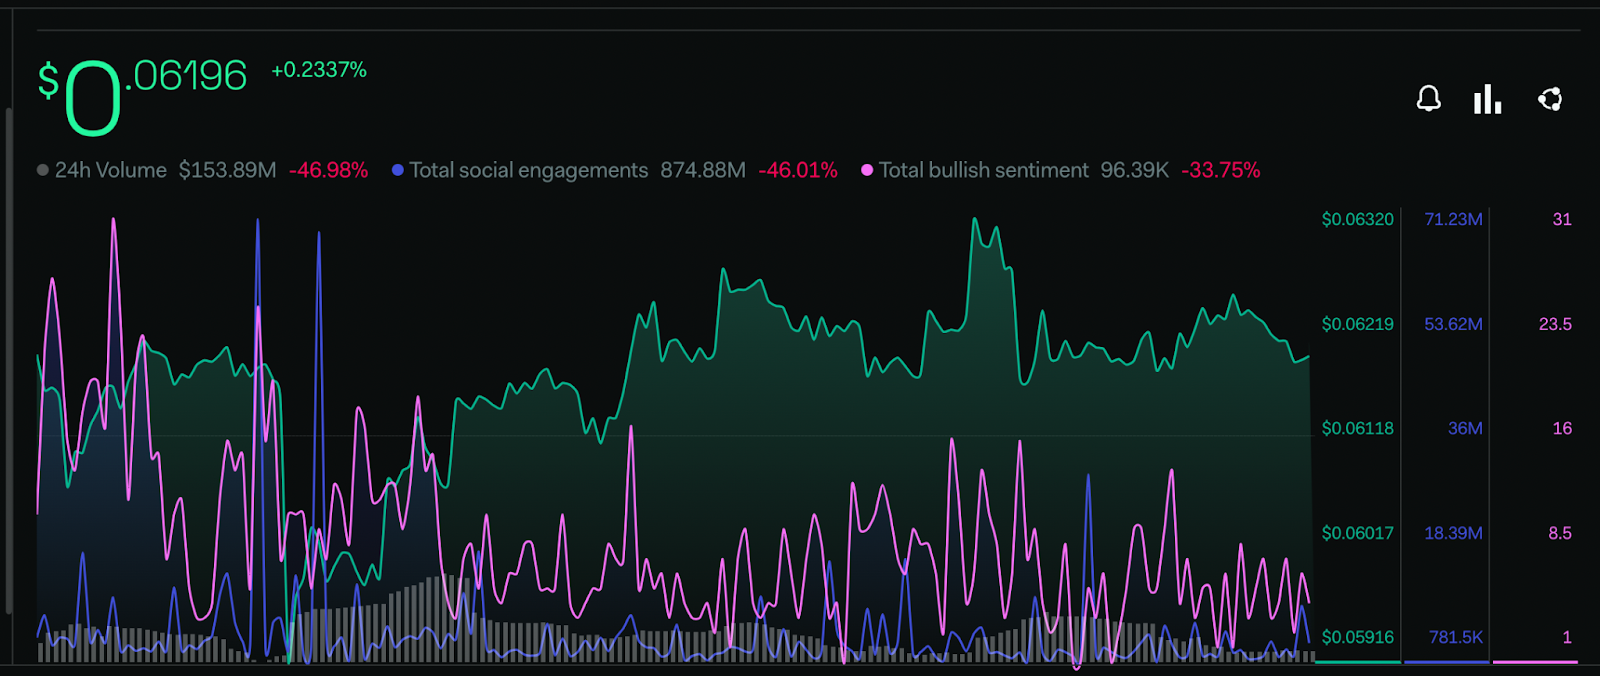
Investors’ sentiments concerning the DOGE token are bearish at present. There is a sharp decrease in the total bullish market sentiments of 33.75% within the last few weeks. The token is also seeing a decline in the social engagement level of -46.01%.
The metrics presented by the LunarCrush platform determine that the inventors are not showing much optimism regarding the token across various social media platforms in the past few months.
Recent Increase in the Fees and TVL of DOGE
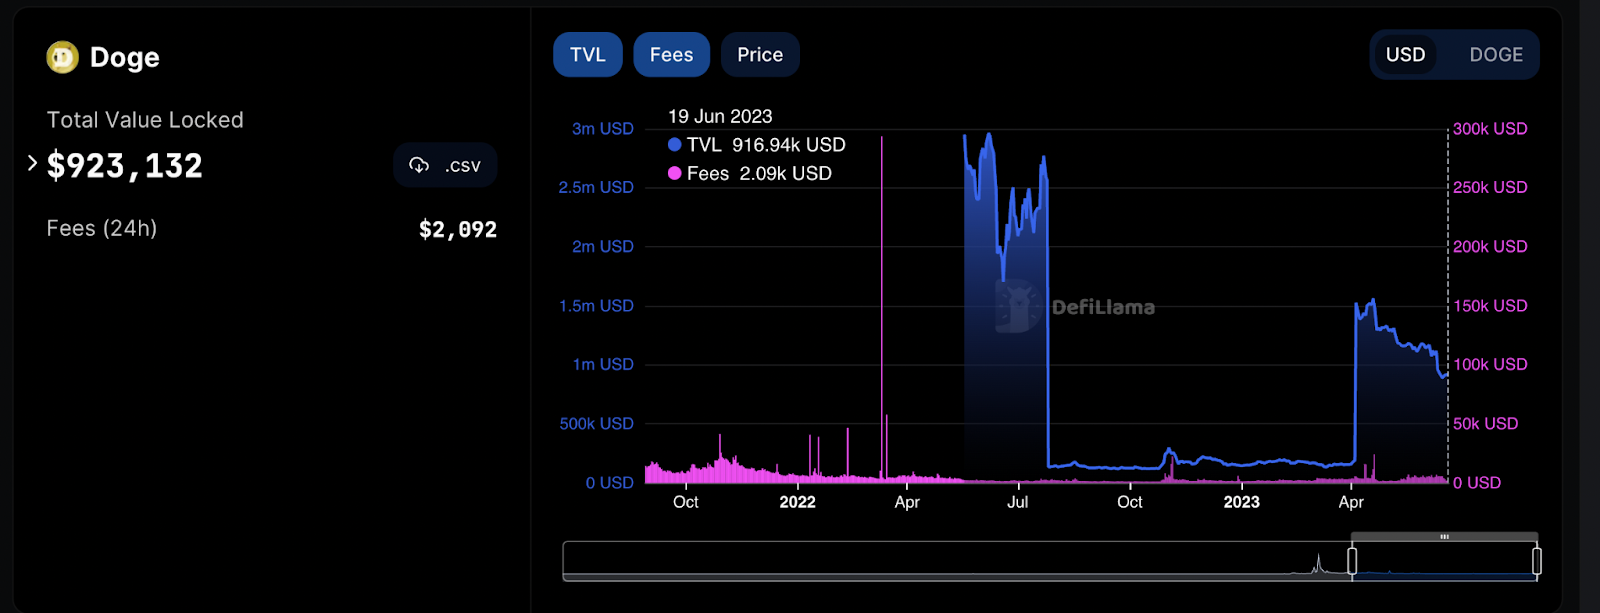
The TVL of DOGE declined significantly near early August. After regaining buyers’ interest and seeing an increase in its value near in late April, it seems to be taking another correction. The present TVL of DOGE is 916.94k observing a change of -2.94% within the last 24 hours.
The fee parameter of Dogecoin is mimicking the TVL, it is seeing a significant decline in value after observing a sudden spike near the end of March. The total fees generated by the Doge platform within the last 24 hours is $2,092.
DOGE Price Broke the Uptrend on Daily Timeframe
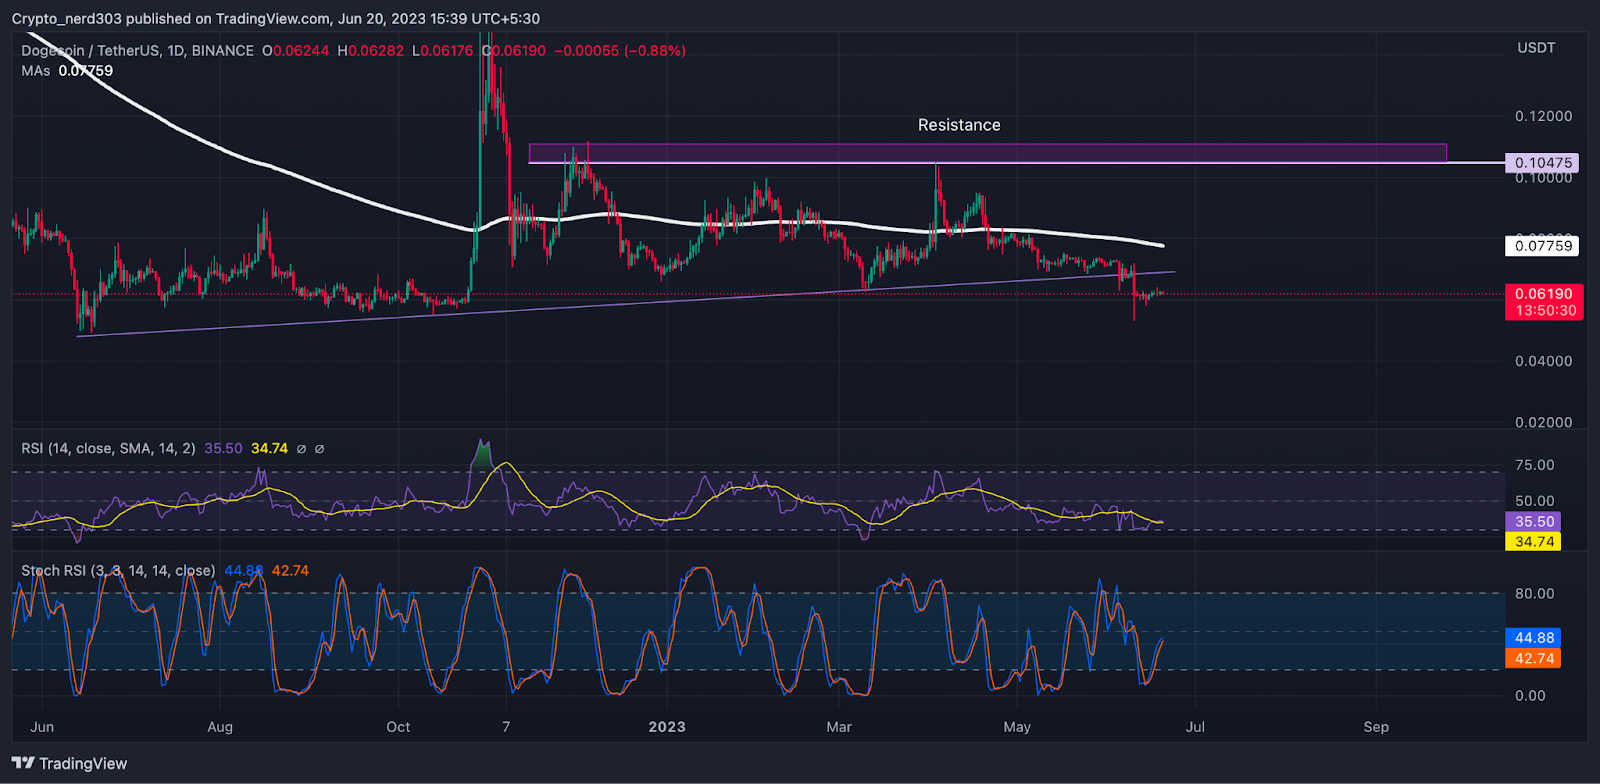
The RSI line has been taking multiple retests from 14 SMA. The RSI value is near 35.50 points in the oversold level points and it is taking resistance from the 14 SMA near 34.74 points.
Stochastic RSI is reaching the median line near 50 points. The %K indicates that it may give a negative interception to the %D line. The current value of the stochastic RSI is 44.88 points.
Conclusion
According to analysis, presently the candle stick pattern suggests that there is a decline in the selling pressure and the market structure is currently within the distribution phase as can be denoted by the long bearish candle, the breaking of the trendline, and the consolidation channel.
Technical levels –
Support – $0.050
Resistance – $0.060 and $0.070
Disclaimer
The views and opinions stated by the author, or any people named in this article, are for informational purposes only, and they do not establish financial, investment, or other advice. Investing in or trading crypto assets comes with a risk of financial loss.

Andrew is a blockchain developer who developed his interest in cryptocurrencies while pursuing his post-graduation major in blockchain development. He is a keen observer of details and shares his passion for writing, along with coding. His backend knowledge about blockchain helps him give a unique perspective to his writing skills, and a reliable craft at explaining the concepts such as blockchain programming, languages and token minting. He also frequently shares technical details and performance indicators of ICOs and IDOs.


