
 Home
Home News
News
- 1 FLOKI price is currently trading in the demand zone and might make a rebound
- 2 The current FLOKI price is $0.000021 with a 24-hour trading volume of 27%
The FLOKI price recently broke its range with an extremely bearish candle. The price is moving within a parallel consolidation channel in the middle of the market structure. The downward curve of price indicates that it may see a further decline in its value. The Investors may prefer to wait on the sidelines whereas the situation presents an ideal opportunity for the short-term buyers and sellers.
The current value of the FLOKI token is $0.000021 and it has a market cap of $204.16 Million.
A Decline In Bullish Sentiment and a Rise In Social Engagement Levels
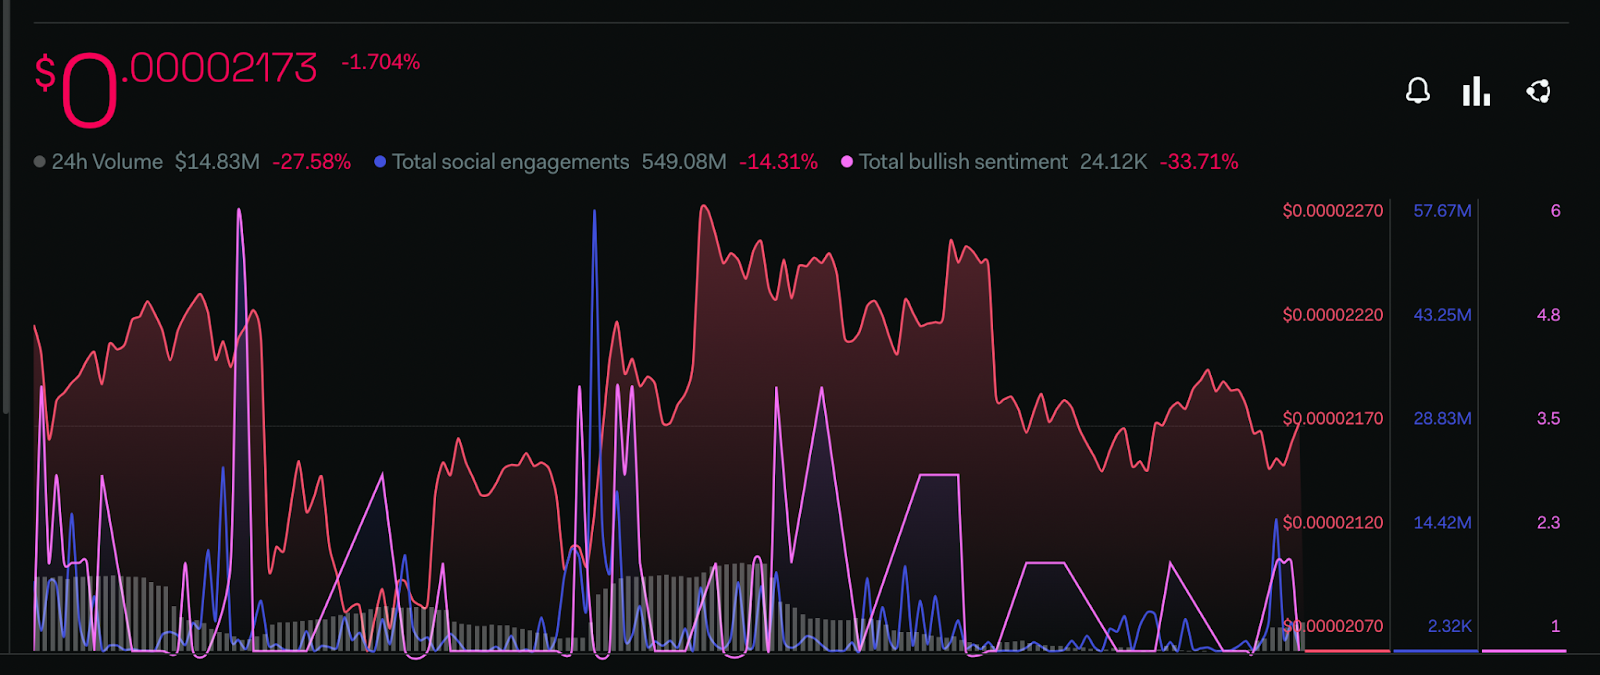
Investors are projecting negative sentiments regarding the FLOKI price observing a decline in the bullish sentiment metrics within the past few days. The total Bullish Sentiment metrics have depreciated by 33.71% whereas there is the total social engagement level fell by 14.31%.
Greed Index of Market Sentiments
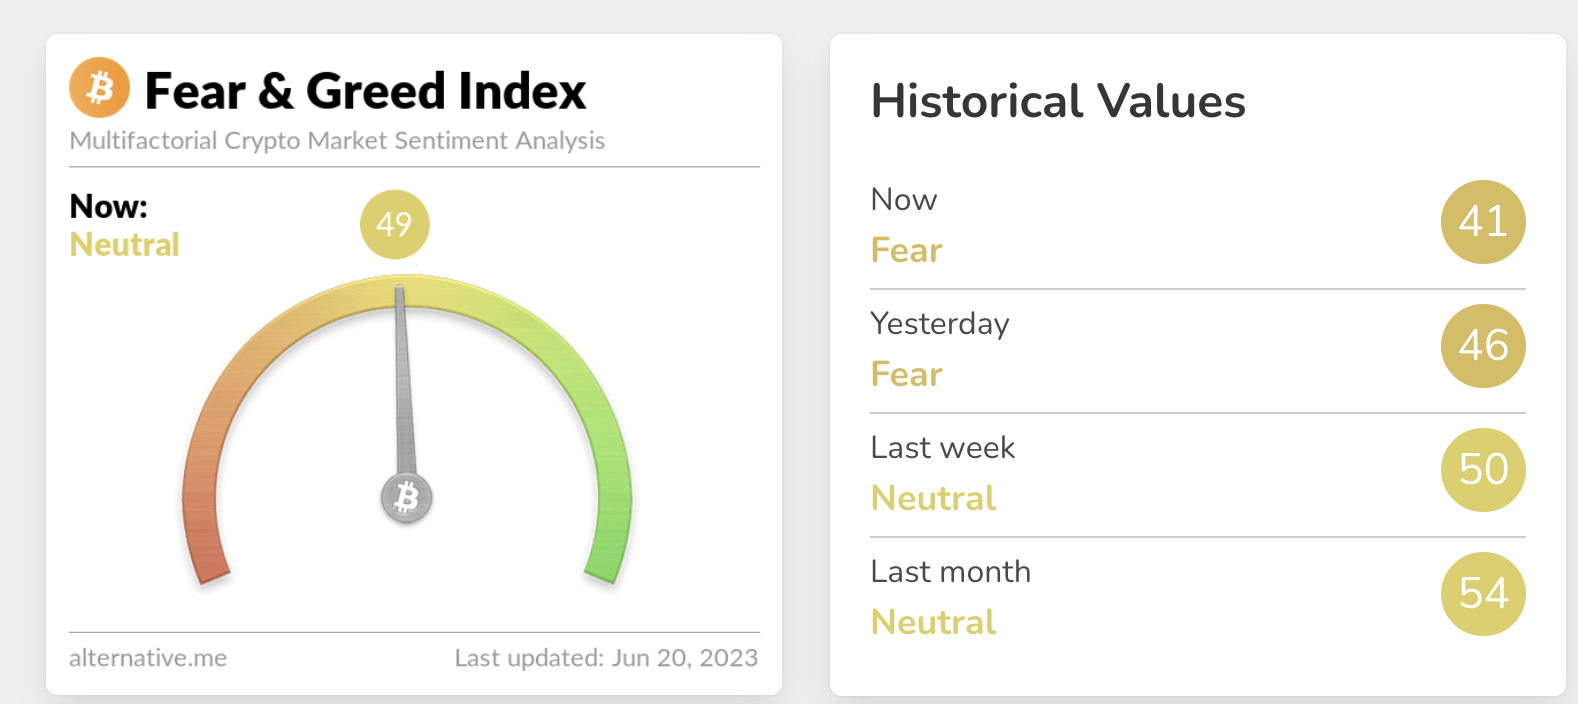
The majority of market sentiments have been in the neutral zone for the past few weeks but at the moment they are taking a decline in value falling into fear zone. The present value of market sentiment within the sentiment index is 41 points, according to the greed and fear index. A stagnancy has been observed in these values for the past few months indicating that investors are close to panic mode.
The bears hold prominence in the price action, however, the bulls are making constant attempts and may eventually regain control within the near future.
Technical Analysis On (1-Day Timeframe)
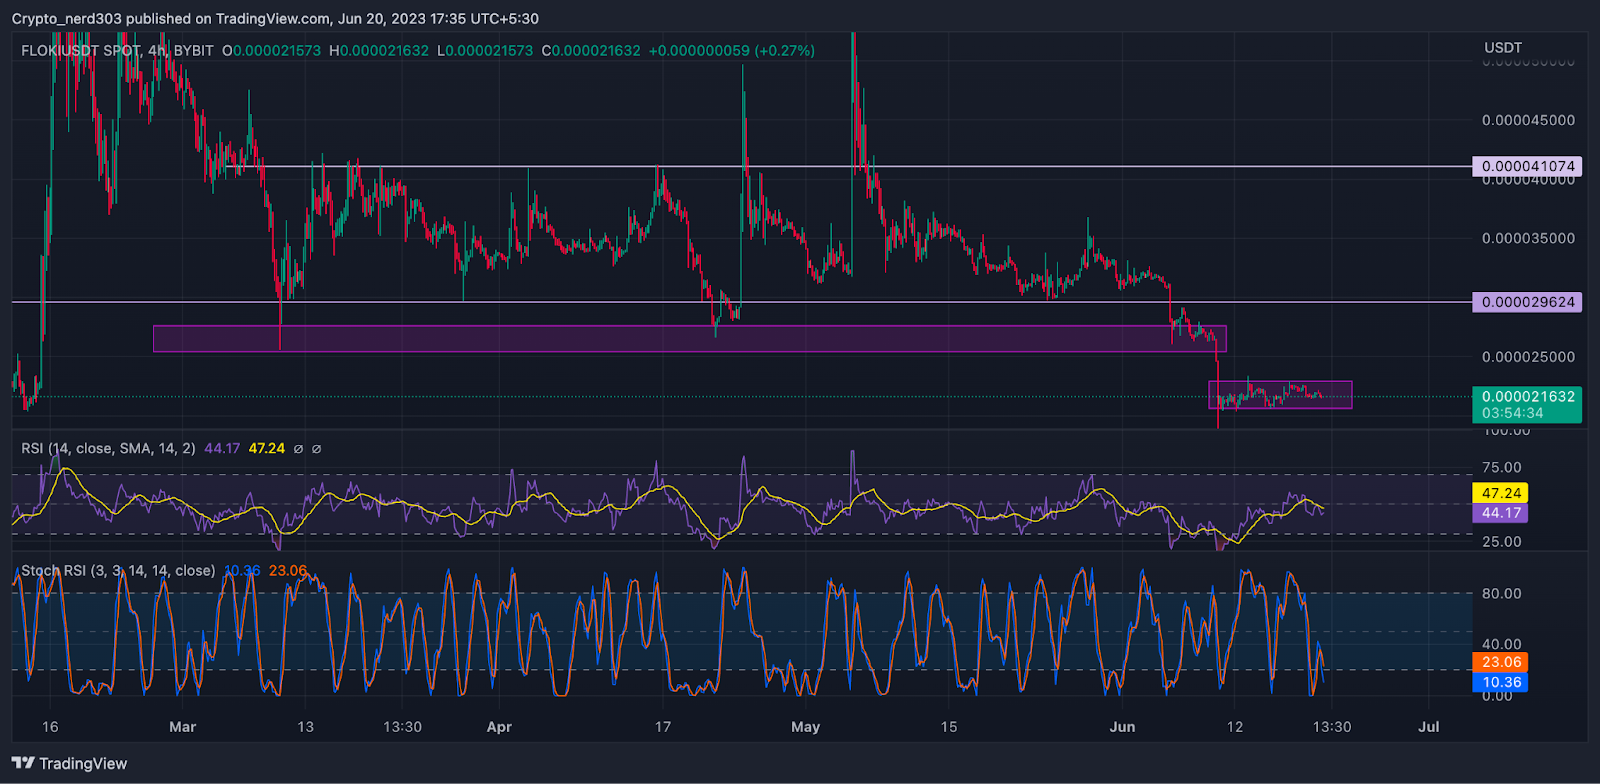
FLOKI coin is currently moving within a consolidation channel. As of now, the price is reaching the base of the consolidation range.
The RSI line is currently trading below the 14 SMA under a downtrend; taking constant retest from the median line. The current RSI value is 44.17 points taking resistance from the 14 SMA which is trading around 47.24 points.
Presently, the stochastic RSI recently took a rejection from the median line. The current value of stochastic RSI is 10.36 points. The %K and %D lines are steadily reaching the demand zone.
Conclusion
According to the analysis, long-term Investors may prefer to wait on the sidelines. The price is moving within a parallel consolidation channel in the middle of the market structure. The oscillators RSI and stochastic RSI are at present moving near the demand zone.
Technical levels –
Support – $0.000020
Resistance – $0.000023
Disclaimer
The views and opinions stated by the author, or any people named in this article, are for informational purposes only, and they do not establish financial, investment, or other advice. Investing in or trading crypto assets comes with a risk of financial loss.

Nancy J. Allen is a crypto enthusiast, with a major in macroeconomics and minor in business statistics. She believes that cryptocurrencies inspire people to be their own banks, and step aside from traditional monetary exchange systems. She is also intrigued by blockchain technology and its functioning. She frequently researches, and posts content on the top altcoins, their theoretical working principles and technical price predictions.


