
 Home
Home News
News
- 1 Shiba inu is currently trading at $0.00000718 while observing a decrease of 0.69% during the intraday session.
- 2 SHIB price is currently trading below the 20,50,100 and 200-day EMAs.
- 3 The year-to-date return of SHIB price is -11.14%.
The bullish rally for Shiba inu began at the starting of 2023, when its price started to rise from the low of $0.000008 level. This move led to the formation of its annual high at $0.00001575 and since then, the price has been in a downtrend.
Recently, SHIB price entered into a consolidation zone ranging between $0.00000840 and $0.00000900. The price consolidated in the range for the whole month of May and during the start of June, the price finally gained bearish momentum and broke the support level of $0.00000840. This breakout led to shattering of the yearly low and resulted in SHIB losing all of its gains.
The cryptocurrency’s price retested the yearly lows and again started to melt down. Currently, the price has formed a support level at $0.00000655 and has started to rise. SHIB price has been bullish for the past 5 days.
The current candle has turned bearish after receiving rejection from $0.00000725. If the current candle can break the lower wick of the previous candle, there is a possibility that the price might suffer a short pullback. In a week, Shiba inu’s price has gained by 7.81%.
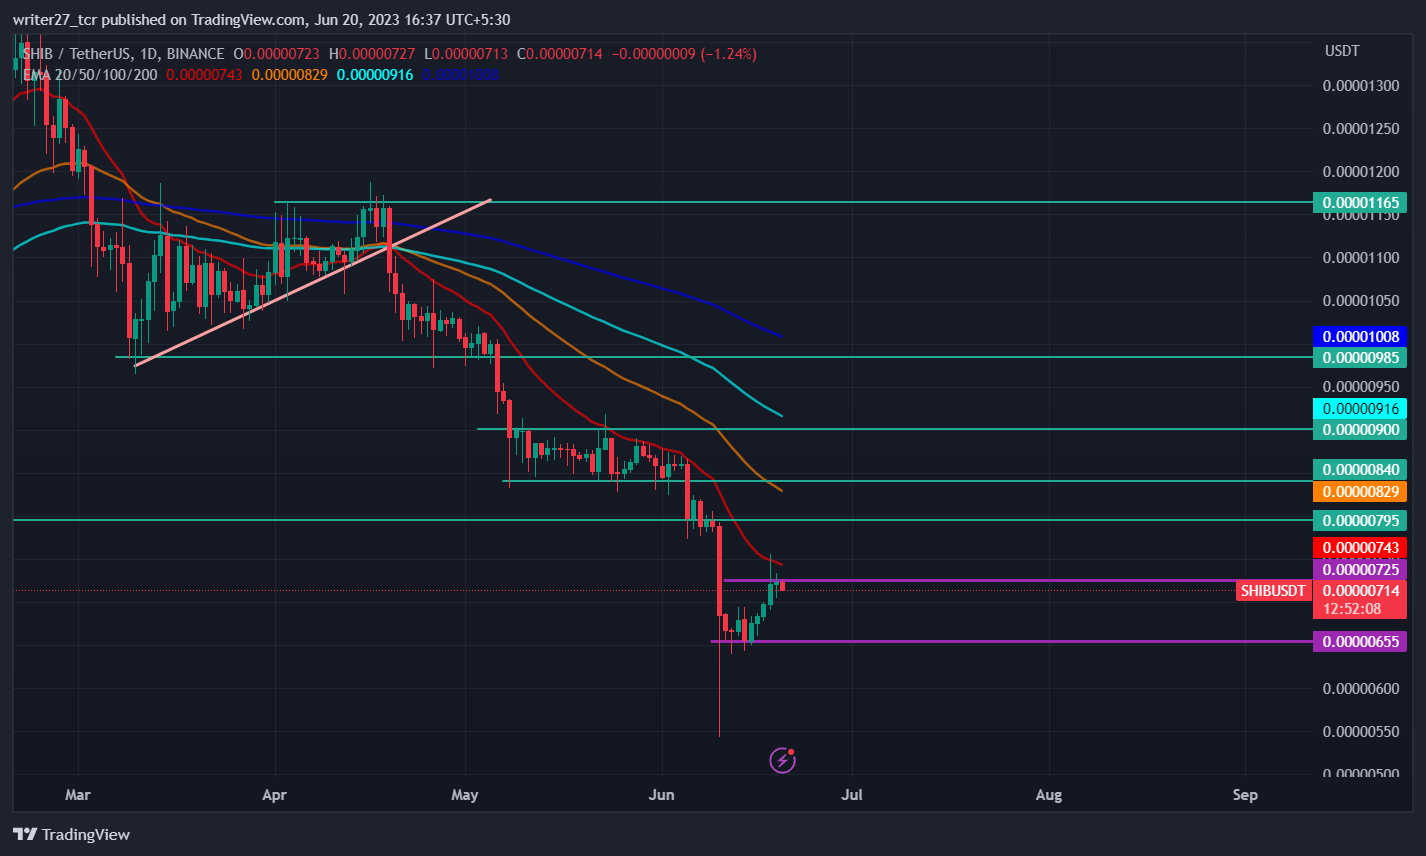
As bitcoin and ethereum have started to recover from their losses, the altcoins have also started to gain bullish momentum. The road to recovery is still long and winding for Shiba inu, as SHIB price needs to secure sufficient buying power to sustain bullish momentum. For price to gain enough bullish momentum, it needs to gain trust of buyers again for which it needs to rise above $0.00001165.
Will SHIB Price Rise Above $0.000008 level?
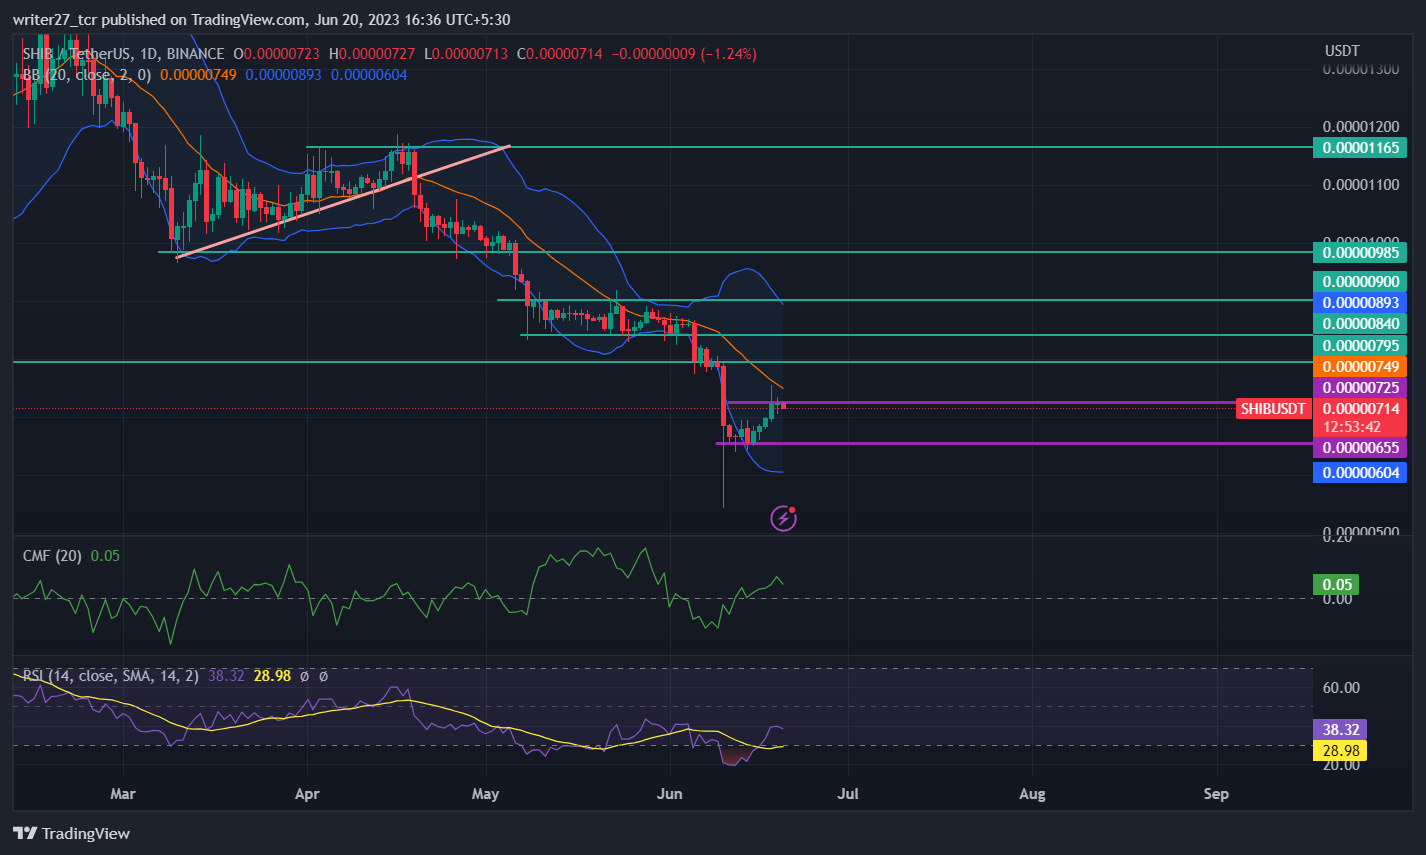
SHIB price trades below the 20,50,100 and 200-day EMAs, indicating bearish momentum in the price. The Chaikin money flow score is 0.05, indicating strength in the market. CMF started to rise from the -0.10 level which indicates that there is increased bullish participation in the market.
RSI trades at 38.65, rising from the oversold region and denoting that price still has bearish momentum. Traders should be cautious before entering into any bids as price has not shown any proper confirmation regarding bullish move.
Currently, Shib price is receiving rejection from the 20-day SMA of bollinger indicating that there is a chance that price might decline to the lower band of Bollinger. The long/short ratio of Shiba inu is 0.81 with 44.99% longs and 55.01% shorts indicating more pressure from the selling side in the last 24 hours which indicates a higher probability of retracement.
Conclusion
The market structure and price action of Shiba inu has turned slightly bullish after a selling spree. The current candle has turned bearish and there is an increase in the selling pressure in the last 24 hours. The technical parameters also show possibility of retracement toward the recent support level.
Technical levels
Major support: $0.00000655 and $0.000006
Major resistance: $0.00000795 and $0.00000840
Disclaimer
The views and opinions stated by the author, or any people named in this article, are for informational purposes only. They do not establish financial, investment, or other advice. Investing in or trading crypto assets comes with a risk of financial loss.

Andrew is a blockchain developer who developed his interest in cryptocurrencies while pursuing his post-graduation major in blockchain development. He is a keen observer of details and shares his passion for writing, along with coding. His backend knowledge about blockchain helps him give a unique perspective to his writing skills, and a reliable craft at explaining the concepts such as blockchain programming, languages and token minting. He also frequently shares technical details and performance indicators of ICOs and IDOs.


