
 Home
Home News
News

- 1 Bulls showed a massive inclining move in the last trading session.
- 2 BCH escaped multiple resistance levels in a single attempt.
Bitcoin Cash price shows a massive bull run; it is escaping multiple resistance levels trading near $130. Moreover, the coin is surpassing the 200 day EMA and sustaining above it shows signs of strength. Furthermore, BCH is showing a long bullish candle and bulls showed their intent by gaining momentum extensively. Moreover, the range breakout was showcased on the charts.

The ongoing price action shows that bulls have gained traction and look strong. This is also demonstrated by the wild move in the intraday session which resulted as a short covering move. The mighty bears were trapped in the last session and they are backfronted now due to the massive spike in price with volume surge.

Moreover, BCH cracked significant moving averages aggressively and sustains above the 200 day EMA mark showing signs of bullishness. Furthermore, the relative upside shows that there is a sign of a rally in the further sessions too and the coin will head towards $150 in the next sessions.
The momentum shifted towards the bulls again and the bears were not able to maintain their range and the bulls were punished in the form of breakout.
When writing, the BCH coin trades at $129.66 with a massive intraday gain of 21.12%, showing a massive incline in move. Moreover, the pair of BCH/BTC is at 0.00448 BTC, and the intraday trading volume increased by 13.70% to $431.25 Million. The intraday high of BCH is $134.25, and the intraday low is $105.34, showing a long range breakout. The market cap of BCH is $2.48 Billion.
Daily Charts Shows Breakout
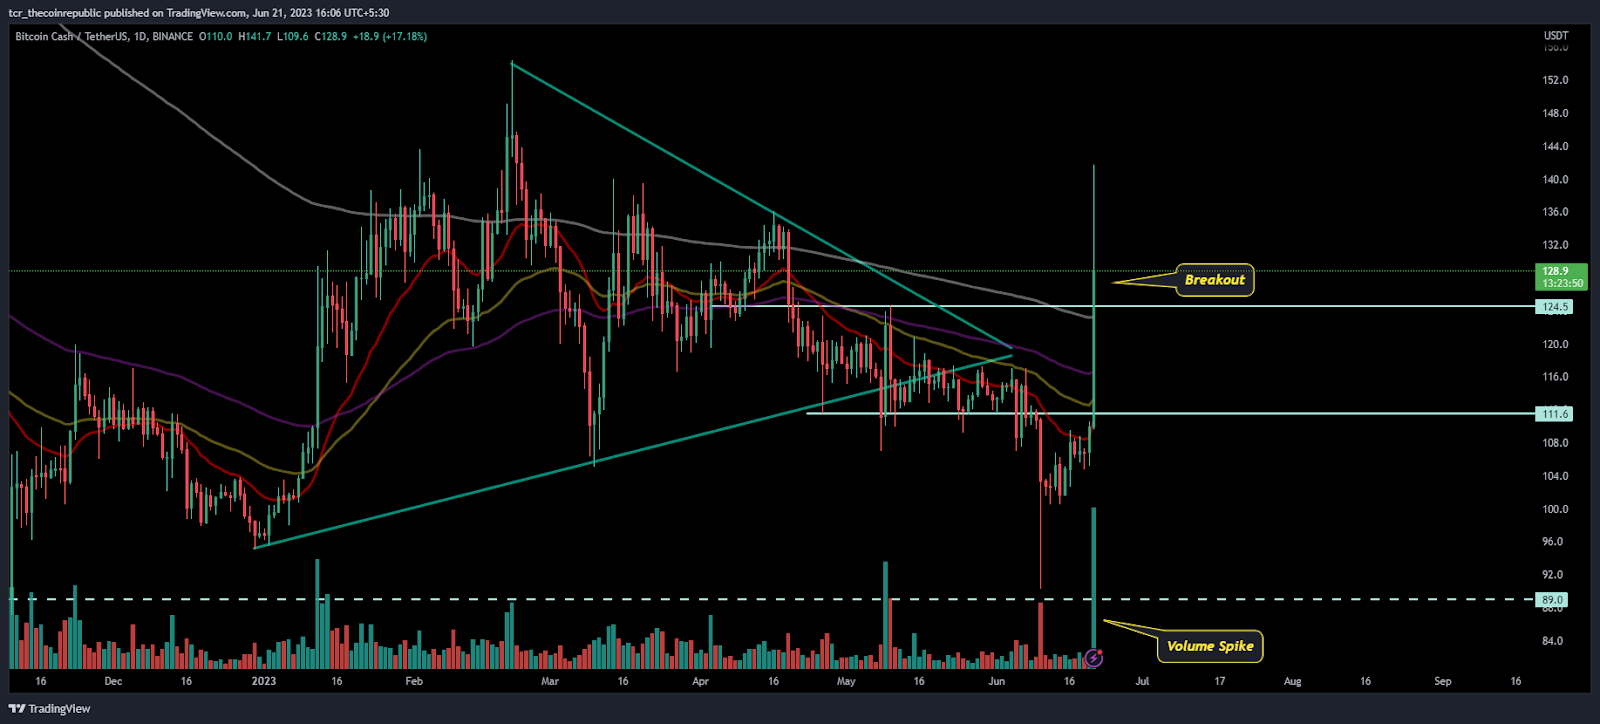
On the daily charts, BCH coin shows massive bull moves and broke out above its trendline resistance of $110. Furthermore, the coin is escaping its key 200-day EMA and is sustaining above it. Now, the 200-day EMA will act as an immediate support and the coin will maintain the gains also above $120.
The traction in prices and the ongoing rebound from the demand zone of BCH shows that it has rescued the gains and is willing to retest the round mark of $150 soon.
Additionally, BCH also smashed above the 61.8% Fib level and is looking to catch its next target of level near $152. Moreover, the price is trading above the upper bollinger band and shows signs of uptrend.
What BCH Indicates on a 4 Hour Chart?
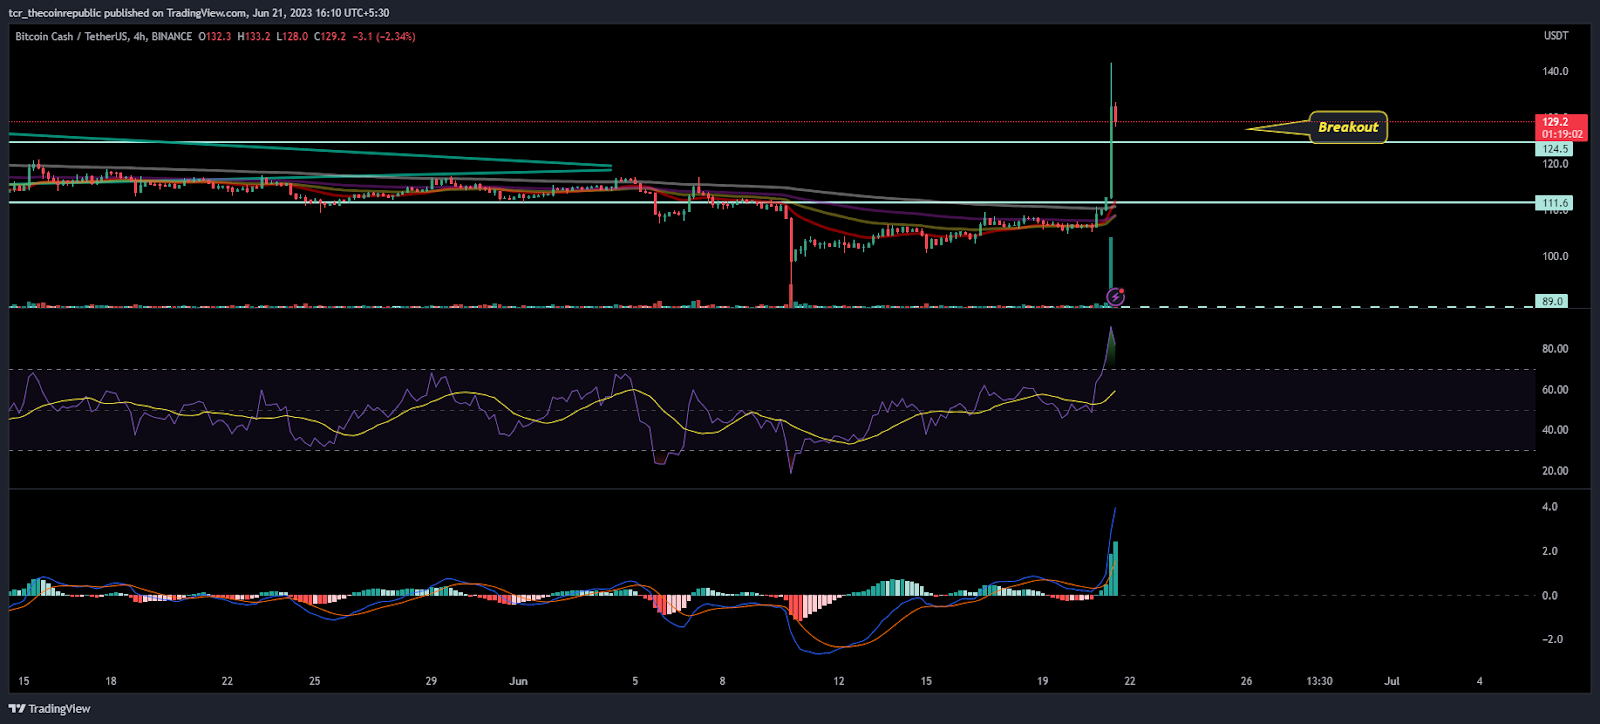
On the 4-hour chart, BCH showed a revival from the demand zone of $100 and gained massive momentum from there and showed a long bullish candle gained by 21% in the intraday session.
This bull move made trapped sellers and stayed in a cautious state, and also signals a short covering move will forward in the next sessions.
Conclusion:
BCH shows an extensive move and bulls are gaining extreme momentum which led the bulls move toward the $150 level in the next few sessions.
Technical levels:
Major support: $120
Major resistance: $150
Disclaimer:
The views and opinions stated by the author, or any people named in this article, are for informational purposes only and do not establish financial, investment, or other advice. Investing in or trading crypto assets comes with a risk of financial loss.

Andrew is a blockchain developer who developed his interest in cryptocurrencies while pursuing his post-graduation major in blockchain development. He is a keen observer of details and shares his passion for writing, along with coding. His backend knowledge about blockchain helps him give a unique perspective to his writing skills, and a reliable craft at explaining the concepts such as blockchain programming, languages and token minting. He also frequently shares technical details and performance indicators of ICOs and IDOs.


