
 Home
Home News
News
- 1 Johnson & Johnson price closed at $164.23 while witnessing a gain of 0.31% during the intraday session.
- 2 JNJ stock price trades above the 20,50,100 and 200-day EMAs.
- 3 The year-to-date return of JNJ stock is -6.77% while the three-month return is 6.31%.
During June, JNJ stock price formed a support level at $154 and started to rise toward the major resistance level of $166.25. Since the start of 2023, JNJ price has been in a downtrend, falling from its high of $180. Recently, JNJ price formed a support near $151 and started to rise to recover from the losses of 2023. The bullish move was halted at $166.25 and the price fell to $154.
Currently, it is rising toward the $166.25 level. If bulls can push price above the immediate resistance, the next target for the price is $173. On the other hand, if JNJ stock price breaks below the recent support level of $161, it might melt down to $158.

Earning Report Impact On Johnson And Johnson Stock Price
The previous earnings report also had a huge impact on the price. Johnson & Johnson beat the consensus estimates of revenue as well as Earnings per share EPS). The estimated revenue was $23.59 billion, but it turned out to be $24.74 billion. The estimated EPS was $2.50, while the company reported an EPS of $2.68.
The net income generated in the first quarter was -$68 million which was a major concern for the investors and induced a sell off in the market. The next Earning report will be released on 20 July, and the consensus has estimated revenue to be $24.68 billion andEPS to be $2.62. The Company reported a revenue of $24.04 billion in the second quarter of 2022.
Will JNJ Price Break the $166.25 Resistance level?
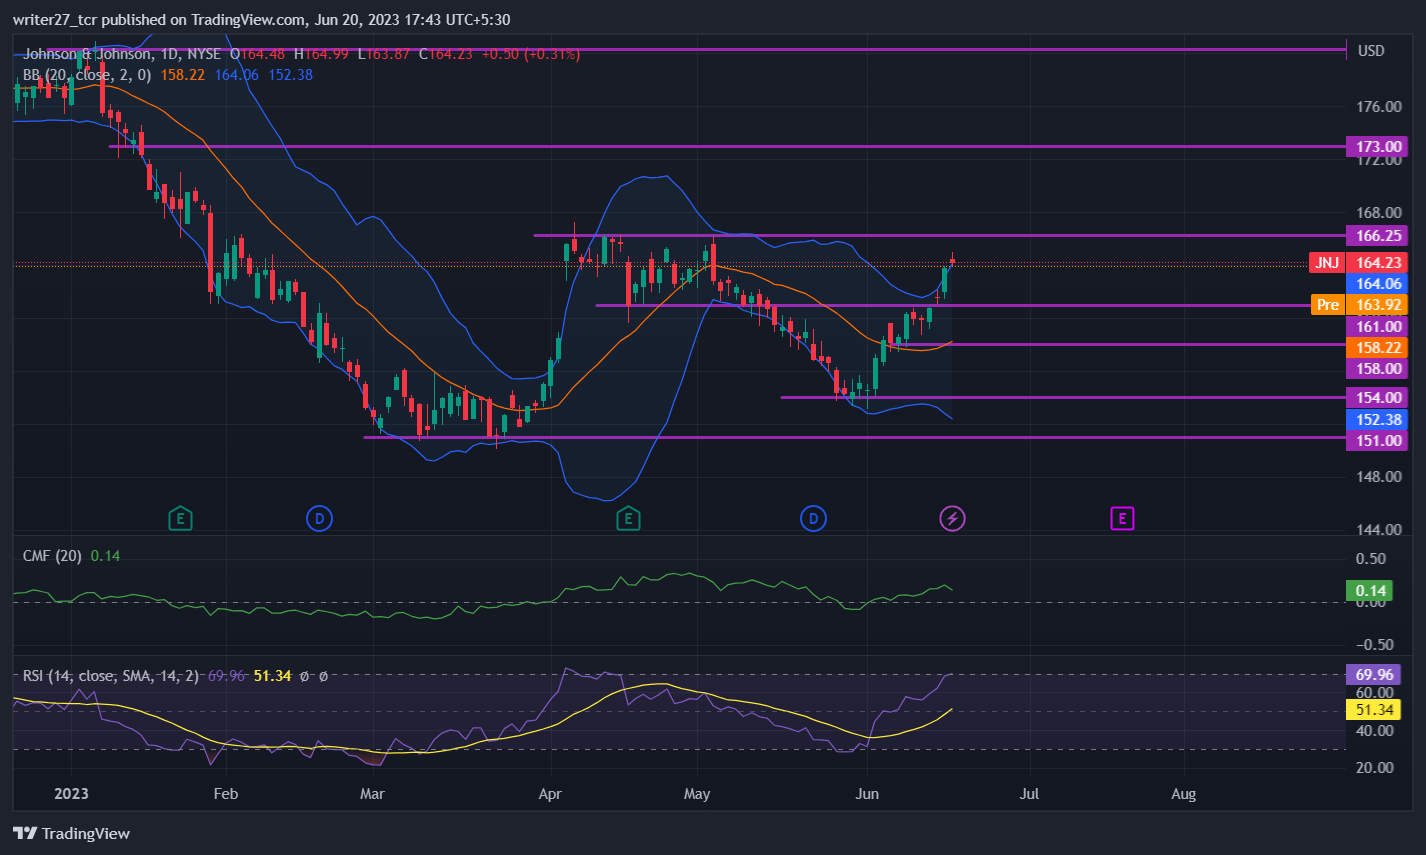
JNJ price traded above the 20,50,100 and 200-day EMAs, indicating bullish momentum in the price. The Chaikin money flow score for Johnson and johnson stock price is 0.14 which implies that there is increased participation of bulls and that the market has strength. CMF did rise from -0.09 since the start of june.
RSI shot up after touching the oversold zone and is currently trading at 69.96 and is on the verge of entering the overbought zone. This is a possibility for the price to witness a short-term pullback if the price enters into an overbought zone. JNJ stock price has reached the upper band of bollinger which also indicates possibility of retracement in the upcoming days toward the 20-day SMA of bollinger bands.
Conclusion
The market structure and price action for JNJ Stock Price is currently bullish. After the release of the first quarter’s earnings report, JNJ stock took a dip and has started to recover. The technical parameters are favouring the buying side but traders should be cautious as RSI and Bollinger bands are showing chances of pullback.
Technical levels
Major support: $154 and $151
Major resistance: $166.25 and $173
Disclaimer
The views and opinions stated by the author, or any people named in this article, are for informational purposes only. They do not establish financial, investment, or other advice. Investing in or trading crypto assets comes with a risk of financial loss.

Andrew is a blockchain developer who developed his interest in cryptocurrencies while pursuing his post-graduation major in blockchain development. He is a keen observer of details and shares his passion for writing, along with coding. His backend knowledge about blockchain helps him give a unique perspective to his writing skills, and a reliable craft at explaining the concepts such as blockchain programming, languages and token minting. He also frequently shares technical details and performance indicators of ICOs and IDOs.


