
 Home
Home News
News
- 1 Stellar price is currently trading at $0.0835 with an increase of 0.97% during the intraday session.
- 2 XLM price has crossed the 20-Day EMA positively.
- 3 The year-to-date return of XLM price is 17.30% while the three-month return is -8.25%.
Stellar is uniting the world with seamless transactions. Stellar, a dencentralized exchange, was founded in 2015 by The Stellar Development Foundation. It aims to bridge the gap between financial systems. It was designed with the goal of enabling swift and reliable transfer of financial resources.
Since the start of April, the price of XLM has been experiencing a pronounced bearish momentum, evident by the formation of a high at the $0.1146 level. The price has been performing zone-to-zone breakout ever since. Recently, XLM price was stuck in a consolidation zone ranging between $0.0860 and $0.0925. During the month of June, the cryptocurrency’s price received rejection from $0.0925 and this initiated a drop which shattered the support level of $0.0860.

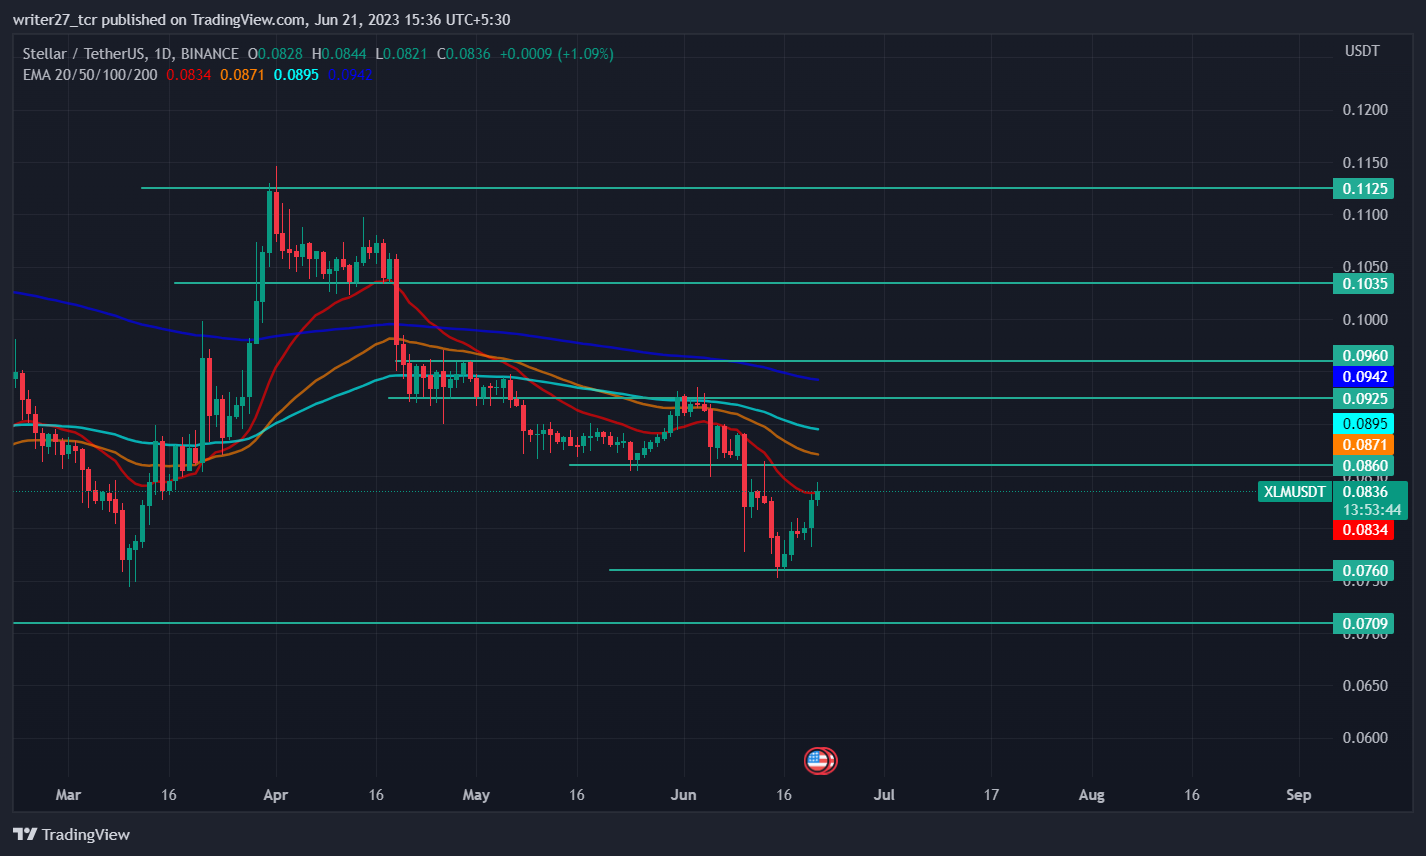
Currently, XLM price has established support at $0.0760 and has started to rise. The price is currently headed toward the support turned resistance level of $0.0860. If the price can rise above the resistance level of $0.086, there is a high probability that the price will head toward the next resistance level of $0.096.
On the other hand, If XLM price receives rejection from the immediate resistance, there is a possibility that price might fall to the recently formed support level of $0.076. The market capitalization of Stellar has increased by 5.33% and is currently at $2 billion. The 24-hour volume of Stellar has also increased by 57.36%. XLM is down by 91.11% from the all-time high of $0.9381.
WIll XLM Price Recover From Its Losses in June?
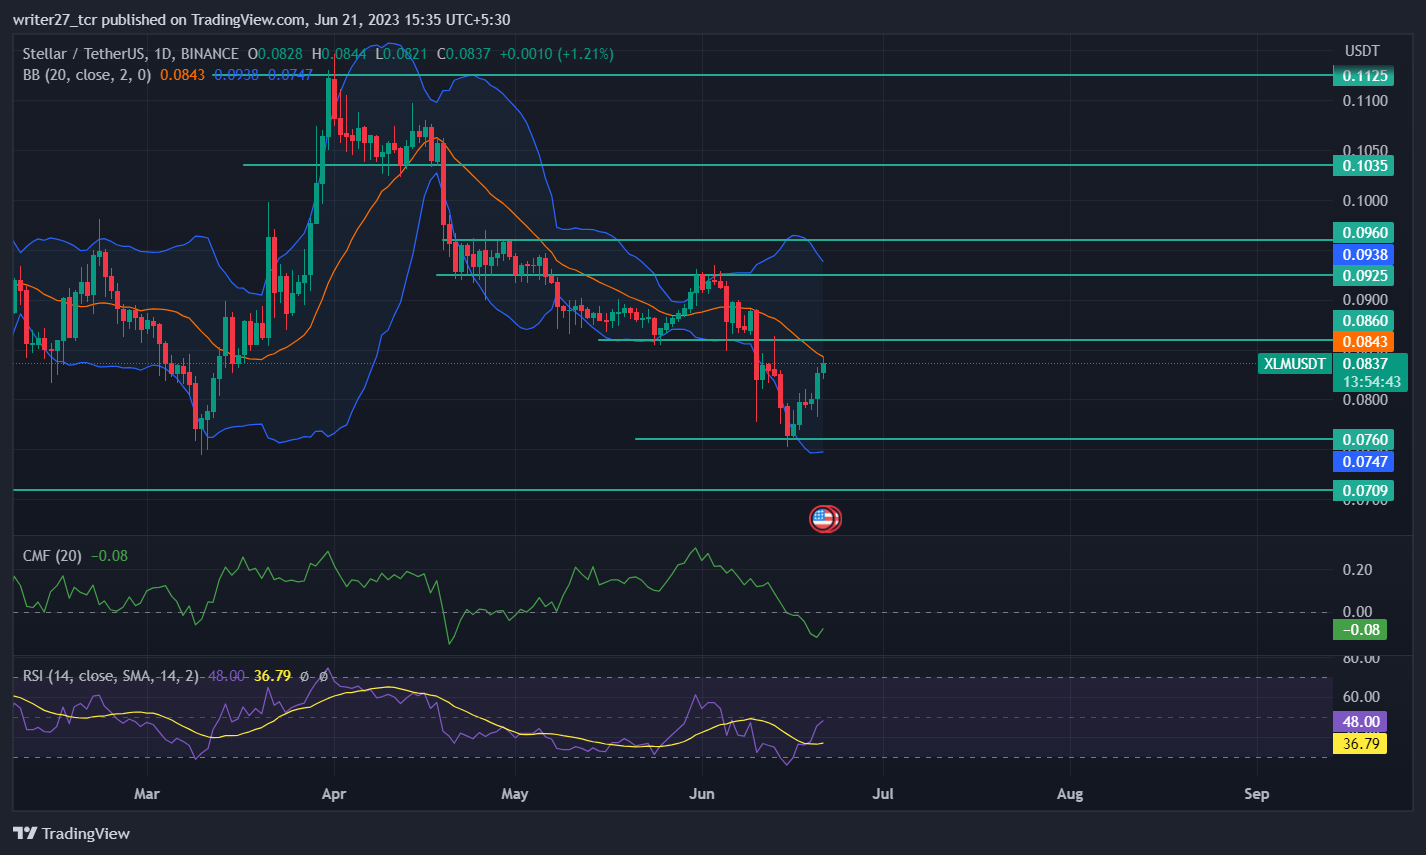
XLM price is gaining bullish momentum and has crossed the 20-day EMA positively. If bullish momentum prevails, XLM price would rise above all the major EMAs and regain the trust of investors. The Chaikin money flow (CMF) score is still below the 0 mark but has started to rise. CMF is currently at -0.08 indicating weakness in the market.
RSI trades at 48 and is shooting up, indicating increased participation of bulls in the market. XLM price reached the lower band of bollinger and started to rise toward the upper band of bollinger. The cryptocurrency’s price has crossed the 20-day SMA of bollinger and the upper band resides near the $0.0925 resistance level. The long/short ratio is 1.02 with 50.63% longs and 49.37% shorts indicating a slight increase in the participation of bulls in the last 24 hours.
Conclusion
The market structure and price action has turned bullish for XLM price after it established support at $0.076. The technical parameters are favoring the buying side. For price to retest the annual high, it needs to rise above the resistance level of $0.1035.
Technical levels
Major support: $0.0709 and $0.0760
Major resistance: $0.0925 and $0.0960
Disclaimer
The views and opinions stated by the author, or any people named in this article, are for informational purposes only. They do not establish financial, investment, or other advice. Investing in or trading crypto assets comes with a risk of financial loss.

Andrew is a blockchain developer who developed his interest in cryptocurrencies while pursuing his post-graduation major in blockchain development. He is a keen observer of details and shares his passion for writing, along with coding. His backend knowledge about blockchain helps him give a unique perspective to his writing skills, and a reliable craft at explaining the concepts such as blockchain programming, languages and token minting. He also frequently shares technical details and performance indicators of ICOs and IDOs.


