
 Home
Home News
News
- 1 Bulls are giving up gains and showing a lack of strength.
- 2 RPL token is struggling near the crucial support of $40.
Rocket Pool token ( RPL ) shows a bearish chart structure and selling over the top from the previous trading sessions and showed a breakdown of the rising wedge pattern. The sellers are gaining fresh momentum and started to make short positions. Furthermore, aggressive selling was noted and token breaks below the 20 day EMA shows that the token is ready to retest the secondary support of $34, which slipped below $40 in the next sessions. Furthermore, the trend is shifting from neutral to bearish as the price dropped across consecutive sessions.
However, RPL paused near the support of $40 and tried to attain strength, and is waiting for a pullback again.

In the past few months, rocket pool token was traded inside the rising parallel, forming higher-highs and higher-lows and convincingly attained the sweet spot of $50. However, as soon as the token hit the spot, sellers activated their muscles and the token entered a distribution phase and started sinking the gains.
The trajectory of the token suggests that on the upside there is a strong resistance mark of $50 which was the supply range, and on the lower side, $38 was the strong support range.
When writing, Rocket Pool was trading at $40.16 with an intraday drop of 1.89% showing bearish indications. Moreover, the pair of RPL/BTC is at 0.001338BTC, and the intraday trading volume decreased by 0.89% to $4.99 Million. The day-high of RPL is $41.54, and the day low is $40.03. The market cap of RPL is $760.74 Million.
Will RPL Manage to Hold Near $40?

On the daily charts, RPL token is showing a negative cue based on the recent downturn and the token is on the verge of the strong support range of $40 which needs to be held for attaining a rebound.
Moreover, the technical parameters suggest that the token is starting to showcase a corrective move after it slipped below the lower trendline of the rising wedge pattern.
The fib level indicates that the token is at the level of 23.6% where it is taking support and made a hammer candlestick pattern.
What Technical Indicators Say?
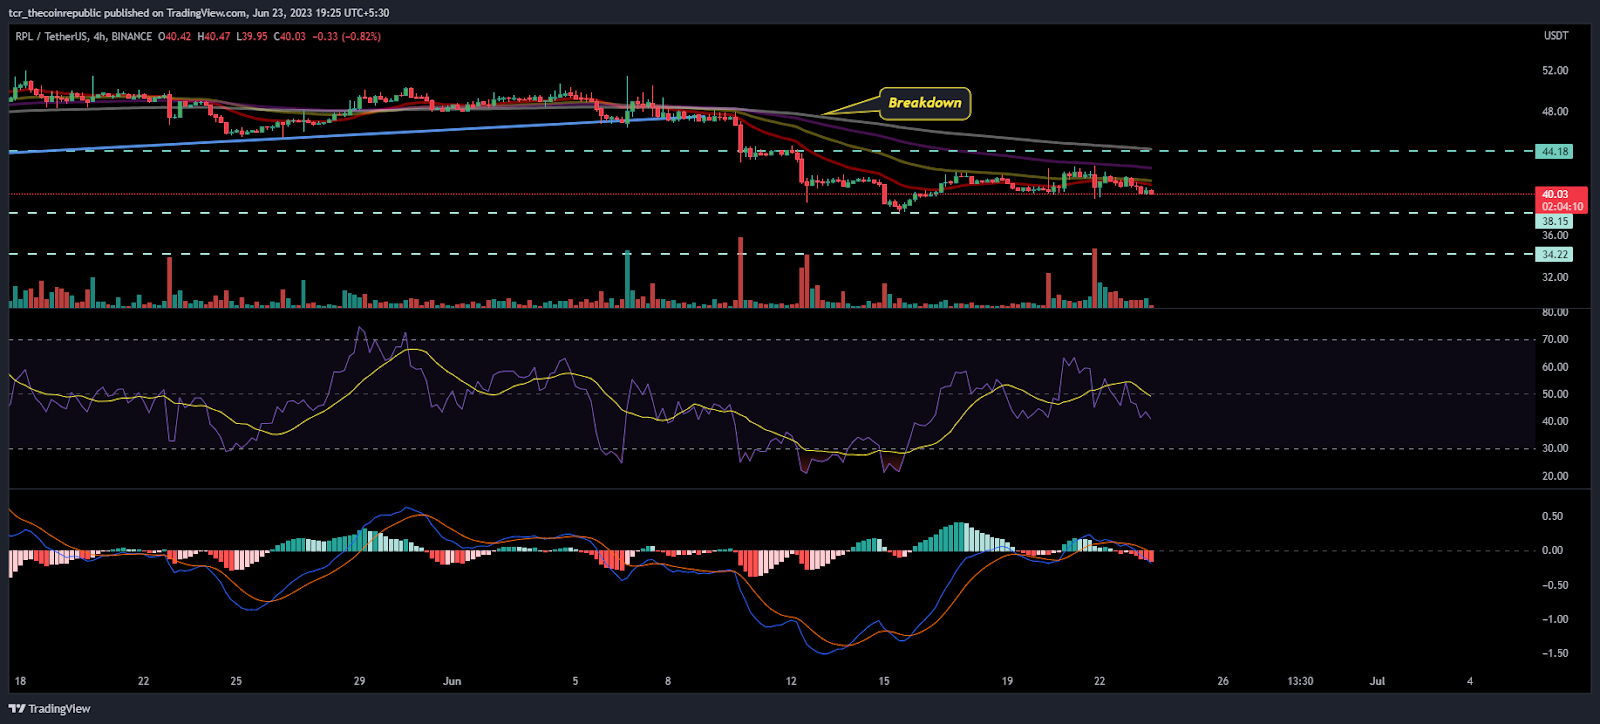
The RSI shows a negative divergence, slipping from the overbought zone indicating that sellers’ presence in the last trading sessions.
The MACD indicator also shows a bearish crossover and red bars on the histogram signify the bearishness of the token.
Conclusion:
RPL token is now at a make-or-break level which if attained, it should bounce, but if it breaks, then the token will head to retest the next support of $34.
Technical levels;
Support Levels: $44
Resistance Levels:$50
Disclaimer
The views and opinions stated by the author, or any people named in this article, are for informational purposes only and do not establish financial, investment, or other advice. Investing in or trading crypto assets comes with a risk of financial loss.

Andrew is a blockchain developer who developed his interest in cryptocurrencies while pursuing his post-graduation major in blockchain development. He is a keen observer of details and shares his passion for writing, along with coding. His backend knowledge about blockchain helps him give a unique perspective to his writing skills, and a reliable craft at explaining the concepts such as blockchain programming, languages and token minting. He also frequently shares technical details and performance indicators of ICOs and IDOs.


