
 Home
Home News
News

- 1 BSV price is showing bullishness on the daily chart.
- 2 Bulls are gaining momentum and are accumulating.
Bitcoin SV price bounced off from its base and strong support near $20, forming a long wick rejection candle indicating the presence of buyers. Moreover, after defending the support zone, a follow-on buying candle confirmed trend-reversal signals.

Afterwards, a massive bounce was noted with a spike in volume, triggering a short covering move and rally in the price. In the last few trading sessions, BSV broke its trendline and the falling wedge pattern neckline at $25, gaining traction.

BSV is now facing the barrier of 200 day EMA and is unable to escape above it, but is trying to surpass the buyers keeping their eyes on it. If buying pressure and the price escapes above $40, then an extensive move will lead the rally towards the round level of $50. The sentiments are in favour of bulls and the sellers were trapped so far.
At the time of writing, Bitcoin SV is trading at $37.45 with a massive intraday gain of 20.27% indicating bullishness. The trading volume also surged by 40% at $324.12 Million in the intraday trading session. Furthermore, the market cap is at $718.79 Million.
Bitcoin SV gained strength in the past few trading sessions and is unwilling to take a break based on the one way bullish move and smashed multiple resistance levels indicating that the bulls have attained strong momentum.
Daily Charts Shows Massive Buying Led by bulls

On the daily charts, Bitcoin SV peaked bullish and ready to blast with further gains, if sustained above the 200 day EMA mark. The buyers are trying to escape the level and waiting to register a fresh breakout. Furthermore, BSV is near the $40 level which was the strong distribution range, where sellers maintained their grip.
BSV is smashing above the upper bollinger band and showed massive strength, suggesting long heavy buildup occurred over the past few trading sessions.
Short Term Charts Shows Breakout of Consolidation
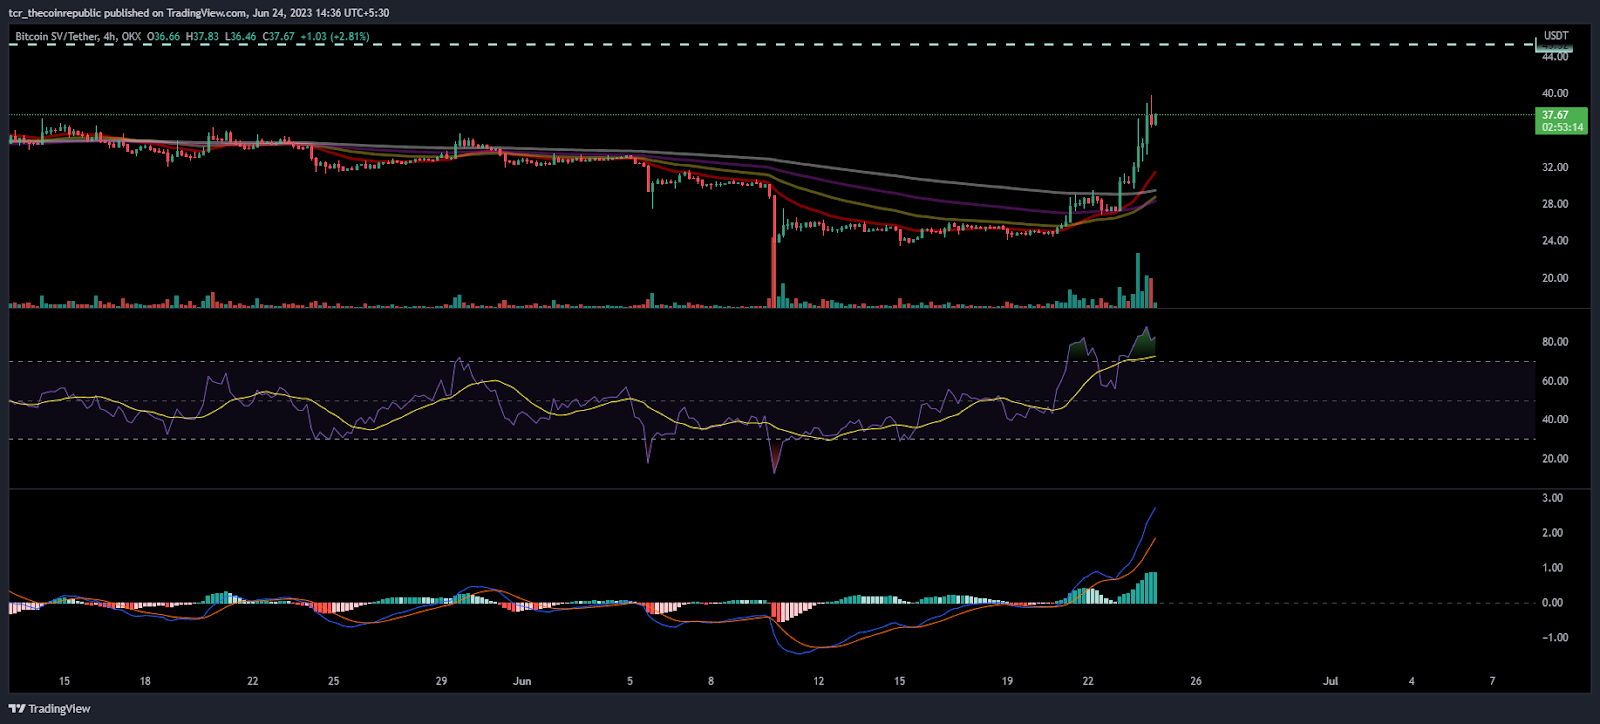
On the 4 hour charts, BSV price is breaking the congestion zone and traded above key moving averages. The ongoing trend led to a sharp recovery from the lows and regained strength again.
The RSI curve is flying above the bars near 80 forming a positive crossover, which indicates buying pressure. The MACD indicator suggests the same, forming a bullish crossover with green bars which reflect on the histogram.
Conclusion
Bitcoin SV price is near the 200-day EMA and is trading in uncharted territory, where buyers are gaining traction. Moreover, the chart formation shows that downside is capped till $30, but upside is having a wide trajectory.
Technical levels –
Support -$30
Resistance – $50
Disclaimer
The views and opinions stated by the author, or any people named in this article, are for informational purposes only, and they do not establish financial, investment, or other advice. Investing in or trading crypto assets comes with a risk of financial loss.

Nancy J. Allen is a crypto enthusiast, with a major in macroeconomics and minor in business statistics. She believes that cryptocurrencies inspire people to be their own banks, and step aside from traditional monetary exchange systems. She is also intrigued by blockchain technology and its functioning. She frequently researches, and posts content on the top altcoins, their theoretical working principles and technical price predictions.


