
 Home
Home News
News
- 1 APE price bounced off from the demand zone.
- 2 Bulls are struggling to gain strength near the 20 day EMA.
Apecoin price is struggling near the bottom and is willing to regain the shine, but due to the lack of momentum, the price is hovering below the 20 day EMA. APE faced rejection from the supply range of $5.000 and has been in a downtrend for the past few months. Now, buyers are trying to gain traction and are looking to sustain above the 20 day EMA to boost the strength.
The price action shows that APE is hovering in the congestion zone and showing a hammer candle on the support which indicates the presence of buyers and delivering a reversal. Furthermore, the chart structure is still favouring the bears due to the sellers’ participation.
If the price sustains above $2.500, then the reversal will extend and the move will head towards the 50 day EMA at $2.800 which needs to be retested to attain further strength.
When writing, APE was trading at $2.315 with an intraday gain of 5.74%, showing a rebound from the bottom of $2.00, but still trading in the bearish territory with charts reflecting selling pressure. Moreover, the trading volume also showed an upside of 11.97%. The market cap of APE is at $304.21 Million.
Daily Charts Shows Rebound From the Demand Zone
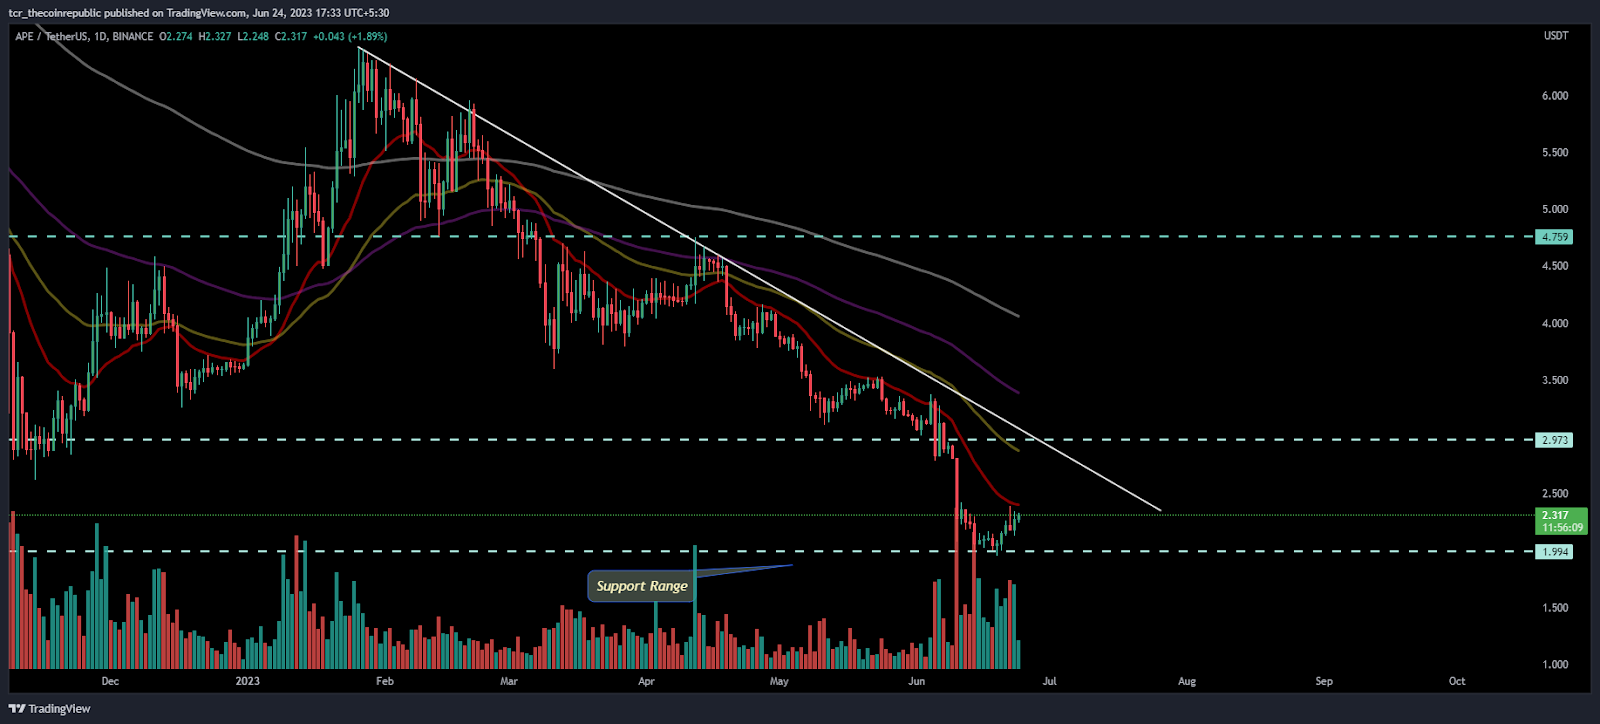
On the daily charts, APE coin shows a lower-highs and lower-lows pattern formation and stayed in a downtrend over the past few trading sessions. The charts structure is indicating a bearish outlook, where the sellers showed their dominance and continued to make short positions.
As per the ongoing trend, price is below the 23.6% Fib level and in the sellers’ region where if moves further down, it could slip below $2.000.
APE on Short Term Charts?
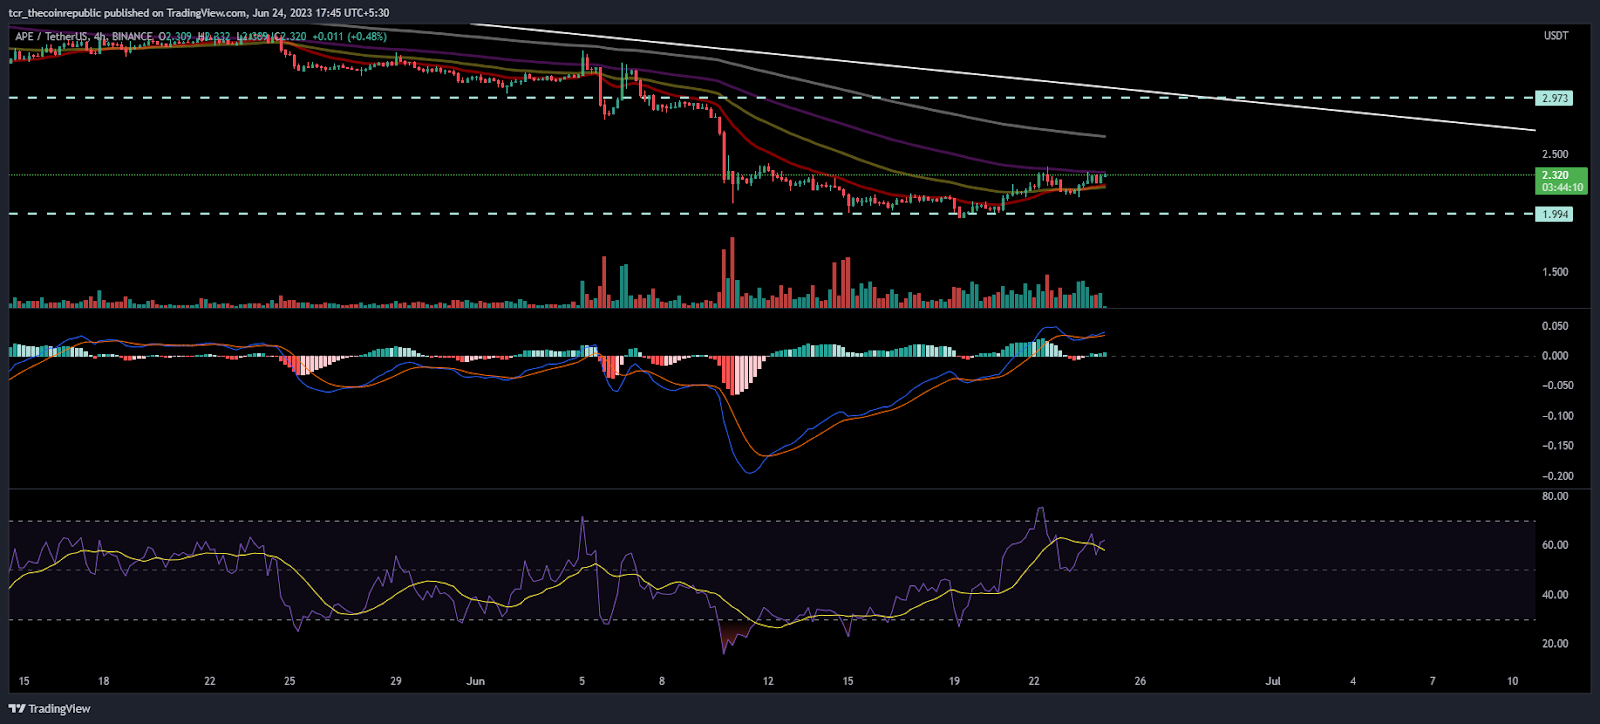
On the 4 hour charts, APE showed a decisive bounce above the neckline of the consolidation zone and looking for an extensive move above the 20 day EMA. Furthermore, it shows a double bottom pattern which suggests further buying projections if sustained above the 20 day EMA.
The RSI curve stays in the overbought zone and persists to project buying perspectives forming a positive crossover. However, the curve shows a volatile move in the last trading session.
The MACD indicator is showing a fresh beginning of bullishness forming a bullish crossover and also showing convergence of moving average.
Conclusion:
Apecoin stayed in the congestion zone and was willing to escape the 20 day EMA mark to gain further momentum. Moreover, investors are being active and looking for further decisive moves to attain bullishness.
Technical Levels:
Support Levels:$2.00
Resistance Levels:$2.60 and $3.00
Disclaimer
The views and opinions stated by the author, or any people named in this article, are for informational purposes only and do not establish financial, investment, or other advice. Investing in or trading crypto assets comes with a risk of financial loss.

Andrew is a blockchain developer who developed his interest in cryptocurrencies while pursuing his post-graduation major in blockchain development. He is a keen observer of details and shares his passion for writing, along with coding. His backend knowledge about blockchain helps him give a unique perspective to his writing skills, and a reliable craft at explaining the concepts such as blockchain programming, languages and token minting. He also frequently shares technical details and performance indicators of ICOs and IDOs.


