
 Home
Home News
News
Loopring token price shows a reversal from the demand zone but cannot escape the 50-day EMA showing rejection. Although the price was getting support from the 20 day EMA, it reacted as a region to halt the gains. Moreover, the token is stuck in the congestion zone and faces strong seller pressure, who continue to make short additions and are willing to break the reversal into a further selloff.
Moreover, the LRC token is forming a wick of rejection at the 50-day EMA, meaning buyers need more stamina to surpass the mark.
At the time of writing, LRC was trading at $0.2450 with an intraday gain of 2.97%, showing a reversal from support marks. Moreover, the trading volume showed an increase of 21.15% at $100.57 Million, showing a massive spike gaining the interest of investors. The pair of LRC/BTC is at 0.0000080 BTC, and the market cap of LRC is $304.39 Million.
The ongoing trend shows that LRC is trading in the sellers region, where bulls are trying to leave the range to initiate further recovery moves. Below the mark of $0.3000 at the 100-day EMA, sellers continue to force the buyers to unwind their positions, but if buyers succeed in escaping the spot, a short covering move will be noted, which can lead to fresh buying spree.
Daily Chart Formation of LRC
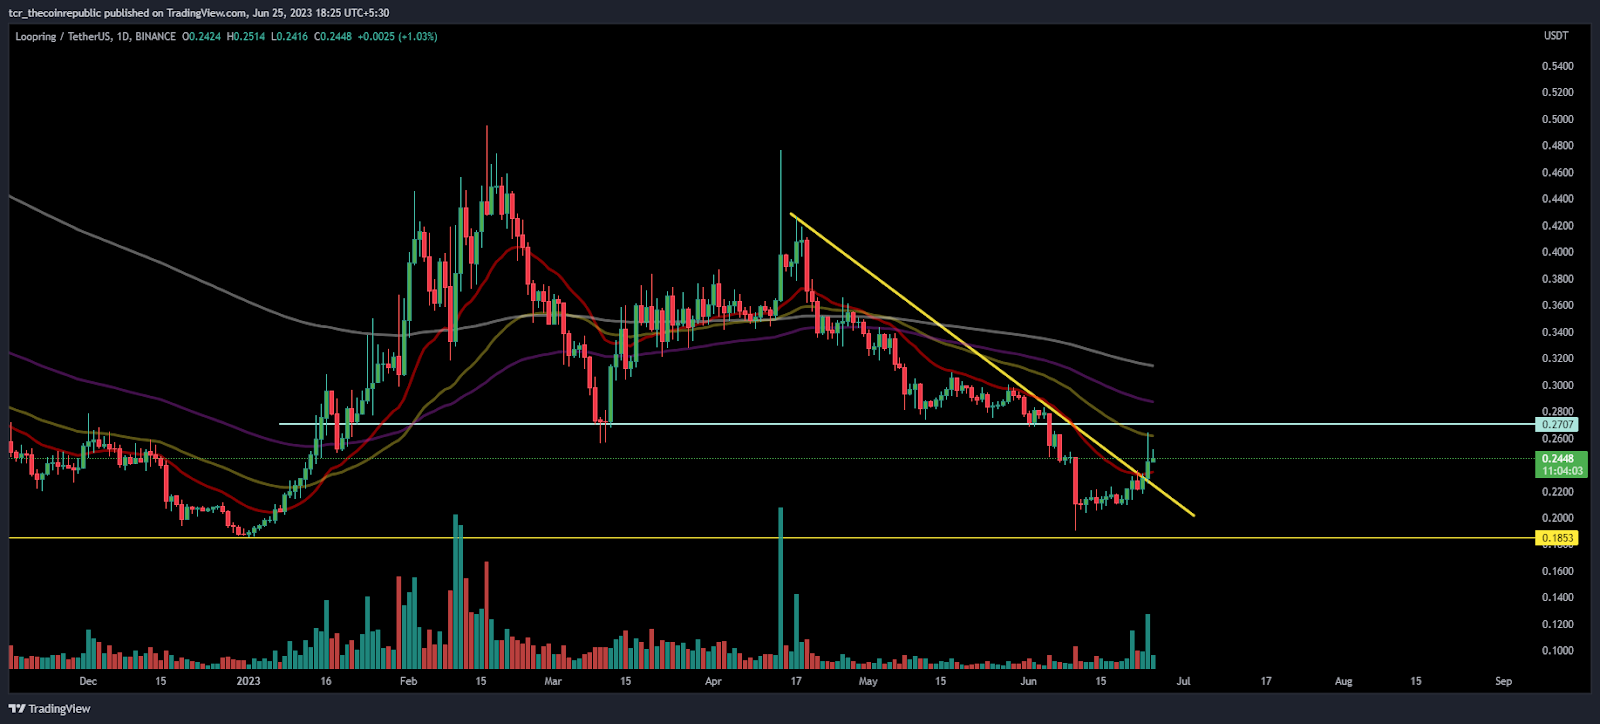
On the daily chart, LRC is breaking its upper trendline and gaining momentum to transcend the 50-day EMA barrier but faces rejection due to the sellers’ grip. However, the buyers continued to pump up the muscles and hold the grip to extend the recovery in the subsequent sessions.
The sellers maintained their dominance in the past few sessions and were not willing to exit the range which caused a hurdle for the bulls to stretch the rebound above the resistance mark of $0.2500.
What LRC Shows on the Short Term Charts?
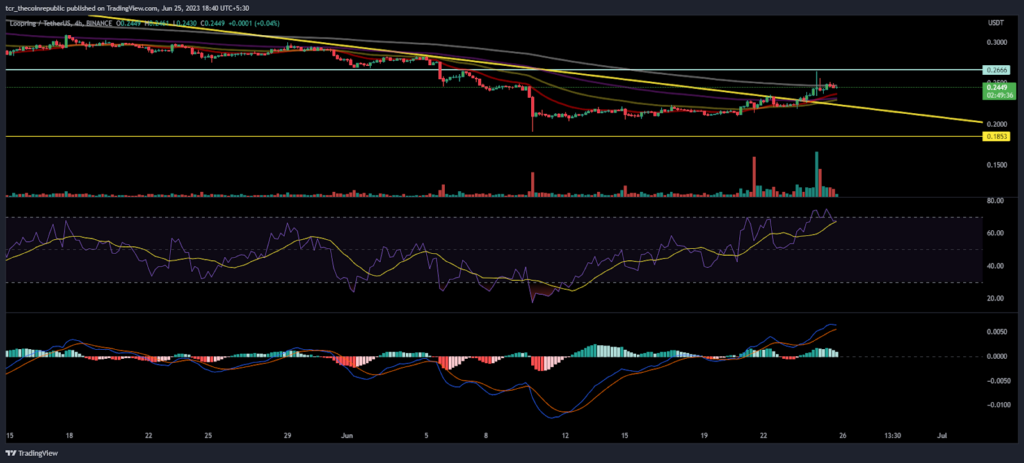
On the 4-hour charts, the LRC token broke the consolidation and overlapped the range above its neckline of $0.2400. Furthermore, buyers are looking to extend the momentum and head their eyes toward $0.2800 and followed by $0.3000.
The RSI curve bounced from neutrality and is floating in the overbought zone, forming a positive crossover.
The MACD indicator was also noted with a bullish crossover and persisted in forming green bars on the histogram, indicating a positive outlook.
Conclusion:
LRC token rebounded from the demand zone of $0.2000, showing recovery with a one-way move sustaining above the 20-day EMA mark and looks to extend its ongoing trend.
Technical Levels
Support Levels: $0.2300
Resistance Levels:$0.2800
Disclaimer
The views and opinions stated by the author, or any people named in this article, are for informational purposes only and do not establish financial, investment, or other advice. Investing in or trading crypto assets comes with a risk of financial loss.

Andrew is a blockchain developer who developed his interest in cryptocurrencies while pursuing his post-graduation major in blockchain development. He is a keen observer of details and shares his passion for writing, along with coding. His backend knowledge about blockchain helps him give a unique perspective to his writing skills, and a reliable craft at explaining the concepts such as blockchain programming, languages and token minting. He also frequently shares technical details and performance indicators of ICOs and IDOs.


