
 Home
Home News
News
- 1 MCO stock is breaking its resistance mark of $325 indicating bullishness.
- 2 The bulls continue to dominate.
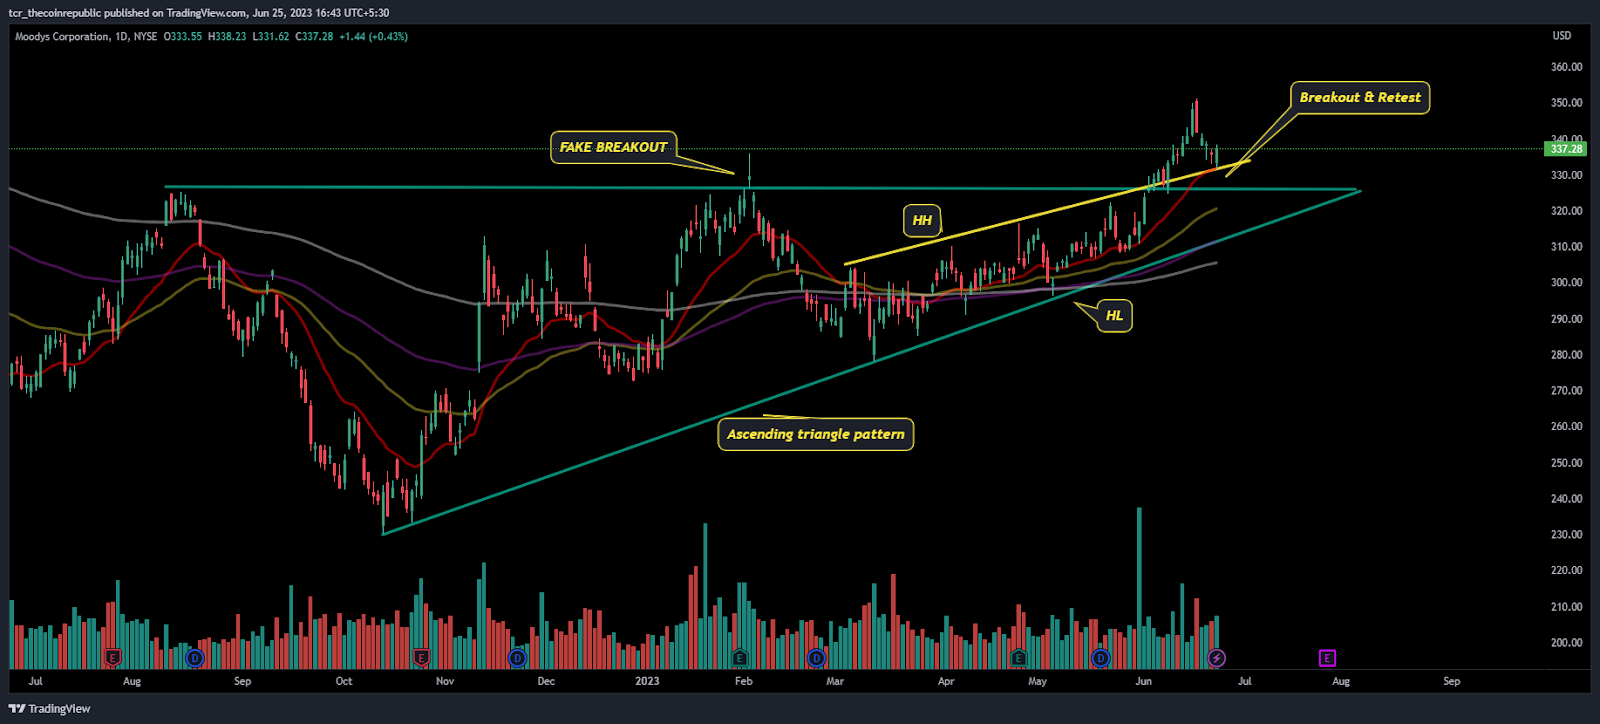
Moody’s Corporation Stock (MCO) price offers buying consequences and trading beyond the key moving averages. Moreover, the stock showed a range breakout and retested the 20-day EMA mark to attain further resilience. However, the stock is already in buying bias, creating higher highs and higher lows, guarding the trendline of the ascending triangle pattern.
MCO stock is spoiling its critical mark of $320, and upholding it above shows the buyers dominance and price rally. Investors are interested in the stock amid a prolonged buildup activity and are extending gains, setting their eyes at the sweet spot of $350.
The ongoing price action shows that the stock is trading in uncharted territory where the downside is capped at $350, but the upside has wide limits toward $350, followed by $400 to be retested in the upcoming sessions.
Moody’s Corporation (Moody’s) is a risk assessment firm. The Company has two segments: Moody’s Investors Service (MIS) and Moody’s Analytics (MA). The MIS segment publishes credit ratings and provides assessment services on various debt obligations, programs, and facilities and the entities that issue such obligations in markets worldwide, including diverse corporate, financial institution, and governmental obligations.
At press time, MCO stock was trading at $337.28 with an intraday gain of 0.43%, the chart showed neutrality. However, the trading volume was 934.265K, up by 1.23% intraday. The market cap of MCO stock is $61.890 Billion.
Daily Charts In Favour of Bulls
On the daily charts, MCO stock is showing a channel and breaking the highs of the neckline and surprisingly retested the 20 day EMA, extending gains.
As per the Fib extension indicator, MCO stock is showing a further trajectory of $344 at 61.8% level and $362 at 78.6% level and at last till $385. These are the levels showing as per the indicator and suggesting a further upright action in the next sessions.
What Technical Indicators say?

MCO stock on the 4 hours chart shows a retracement from the top and shows profit booking on the charts. Moreover, the sellers showed their presence and aggressively made short positions forcing the stock to retest the 20 day EMA.
The RSI curve showed a drop from the overbought zone and a negative crossover was noted, showing mild correction over the top.
The MACD indicator also showed a bearish crossover and noted red bars on the histogram. indicating a volatile move.
Conclusion:
MCO stock is staying in the bullish territory, but showing a corrective move showed a profit booking move in the last trading sessions.
Technical Levels:
Support Levels:$325
Resistance Levels:$350 and $365
Disclaimer
The views and opinions stated by the author, or any people named in this article, are for informational purposes only and do not establish financial, investment, or other advice. Investing in or trading crypto assets comes with a risk of financial loss.

Andrew is a blockchain developer who developed his interest in cryptocurrencies while pursuing his post-graduation major in blockchain development. He is a keen observer of details and shares his passion for writing, along with coding. His backend knowledge about blockchain helps him give a unique perspective to his writing skills, and a reliable craft at explaining the concepts such as blockchain programming, languages and token minting. He also frequently shares technical details and performance indicators of ICOs and IDOs.


