
 Home
Home News
News

- 1 Ethereum price is currently trading at $1868.31 with a gain of 0.48% during the intraday session.
- 2 ETH price trades above the 20,50,100 and 200-day EMAs.
- 3 The year-to-date return is 56.18%.
Ethereum price has been in an uptrend since the start of 2023, as price started to rise from the low of $1190 and formed higher lows. During March, ETH price formed the support level at $1420 and then formed its annual high at the 2141.54 level. After this, ETH price entered into a bearish trend and established support at $1790.

During June, the cryptocurrency’s price gained enough bearish momentum to shatter the support level of $1790. The price fell straight down to form the new support level at $1644.

Recently, ETH price commenced a bullish rally to recover the losses and broke above the support-turned-resistance level of $1790. The move was halted at $1910. The price entered into a small consolidation zone near the $1910 level on smaller time frames but the previous candle managed a breakout from the zone. If the current candle can break the lower wick of the previous candle, there is probability for the price to enter into a corrective phase and head toward $1800.
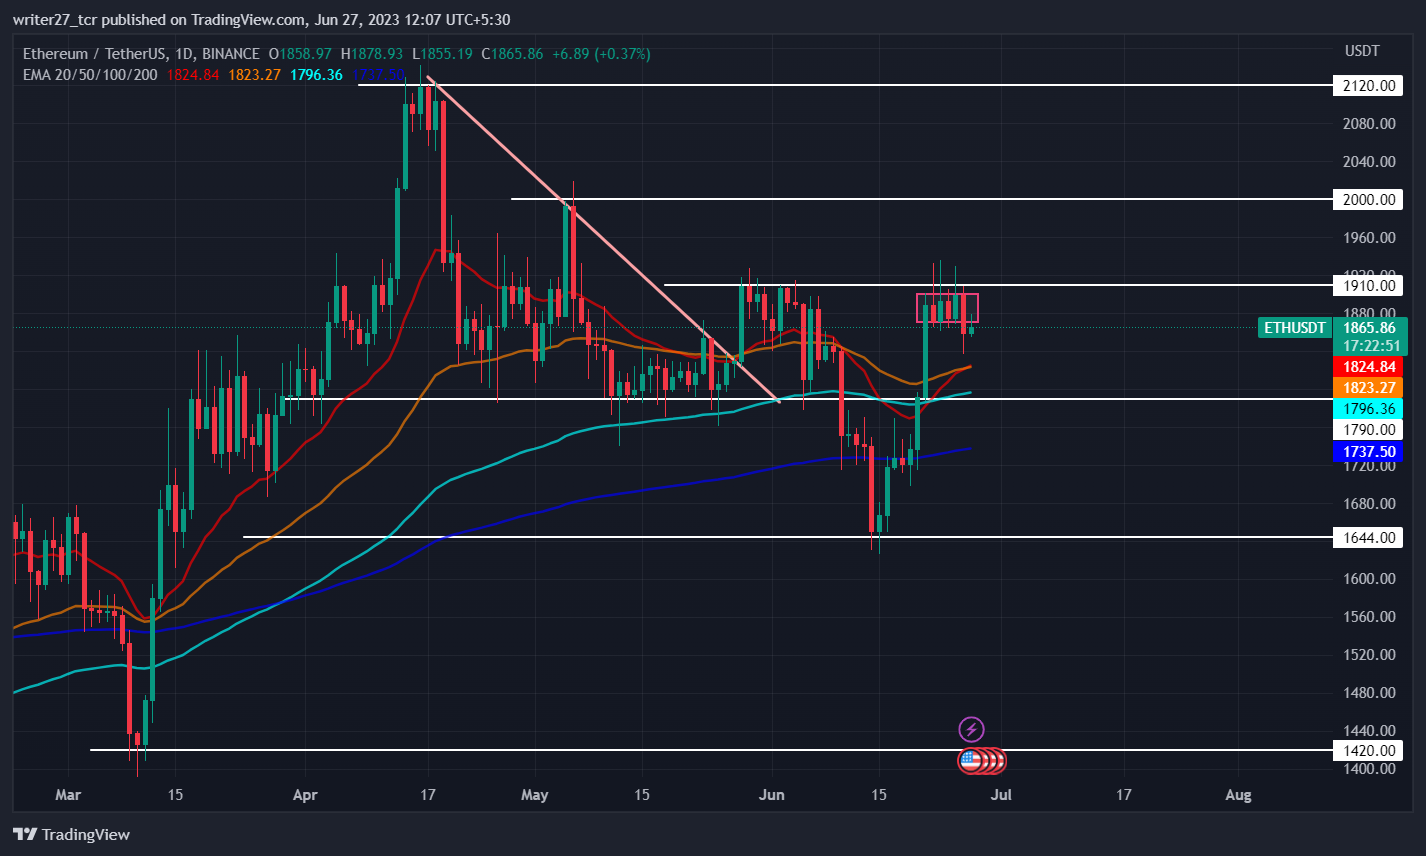
On the 4-hour time frame, the candles are depicting a retest of the previous zone. Ethereum price has shown an increase of roughly 17% in nearly 10 days and the current move can be a short-term pullback for price to form a strong support and rise even higher.
If bulls take control and drive the price above the $1930 level, it might head toward $2000 and potentially break it to rise higher toward the annual high. The price is struggling to rise and stay above $1900. If a break of the lower wick of the previous candle occurs, the price might decline further.
Will ETH Price Decline to $1800 level?
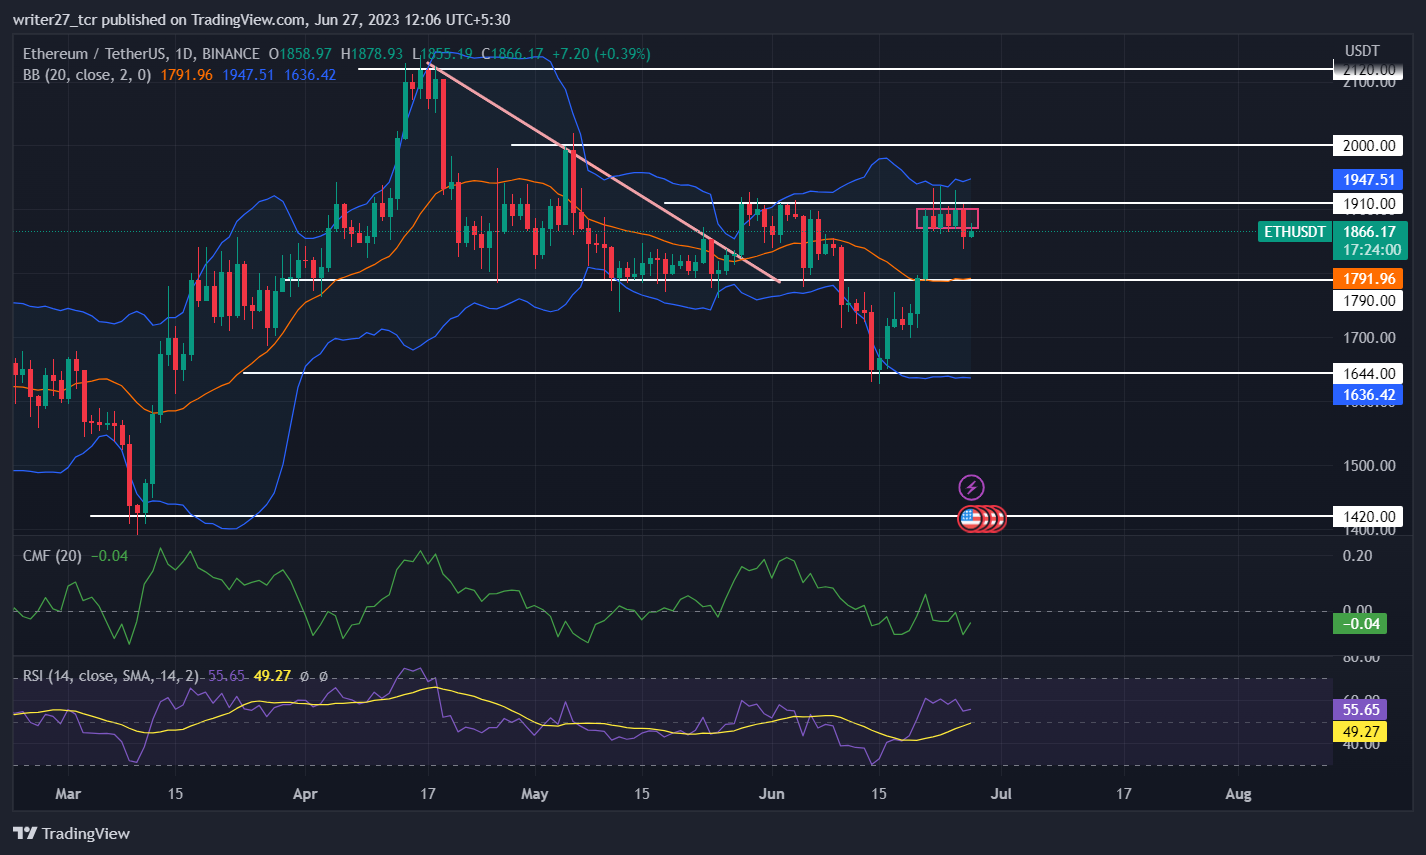
The price is trading above the 20,50,100 and 200-day EMAs, indicating bullish momentum and participation of buyers in the market. The Chaikin money flow score has dropped below 0 and is currently at -0.04, suggesting weakness in the price. Relative strength index (RSI) moved sideways for a couple of days but it has recently started to dip.
RSI trades at 55.46, suggesting that there is still bullish pressure left in the price. The bands of bollinger have expanded which indicates higher volatility in the market. Ethereum price is facing resistance from the upper band of bollinger and is currently headed in the downward direction. The long/short ratio is 0.95 with 48.93% longs and 51.07% shorts, indicating higher pressure from the selling side in the last 24 hours.
Conclusion
The market structure and price action for Ethereum was bullish but is slowly turning bearish as price breaks below the small consolidation zone. The technical parameters are suggesting that there is a chance of short-term pullback in the price toward the $1800 level.
Technical levels
Major support: $1644 and $1790
Major resistance: $2000 and $2120
Disclaimer
The views and opinions stated by the author, or any people named in this article, are for informational purposes only. They do not establish financial, investment, or other advice. Investing in or trading crypto assets comes with a risk of financial loss.

Andrew is a blockchain developer who developed his interest in cryptocurrencies while pursuing his post-graduation major in blockchain development. He is a keen observer of details and shares his passion for writing, along with coding. His backend knowledge about blockchain helps him give a unique perspective to his writing skills, and a reliable craft at explaining the concepts such as blockchain programming, languages and token minting. He also frequently shares technical details and performance indicators of ICOs and IDOs.


