
 Home
Home News
News
- 1 1inch price is trading at $0.3117 while observing a loss of 2.29% during the intraday session.
- 2 1inch price trades below the 20, 50,100 and 200-day EMAs.
- 3 The year-to-date return of 1inch is -18.64% while its weekly return is 6.31%.
1inch price was bullish during the beginning of 2023, when the price started to rise from the low of $0.38 and formed the annual high at $0.6970. Since then, the price has been in a downtrend. During March, the price formed a support level at $0.4350 level and initiated a bullish rally to retest the annual high but the price faced strong resistance once more from the $0.6070 level, which reignited a bearish sentiment in the price.
During May, the cryptocurrency’s price broke the major support level of $0.4350 with strong bearish momentum and entered June with the same sentiment.

Recently,the price formed a support at the $0.26 level and started its bullish journey to recover from the losses. The move was halted as the price faced strong rejection from the $0.3505 level and formed the resistance level at $0.33.
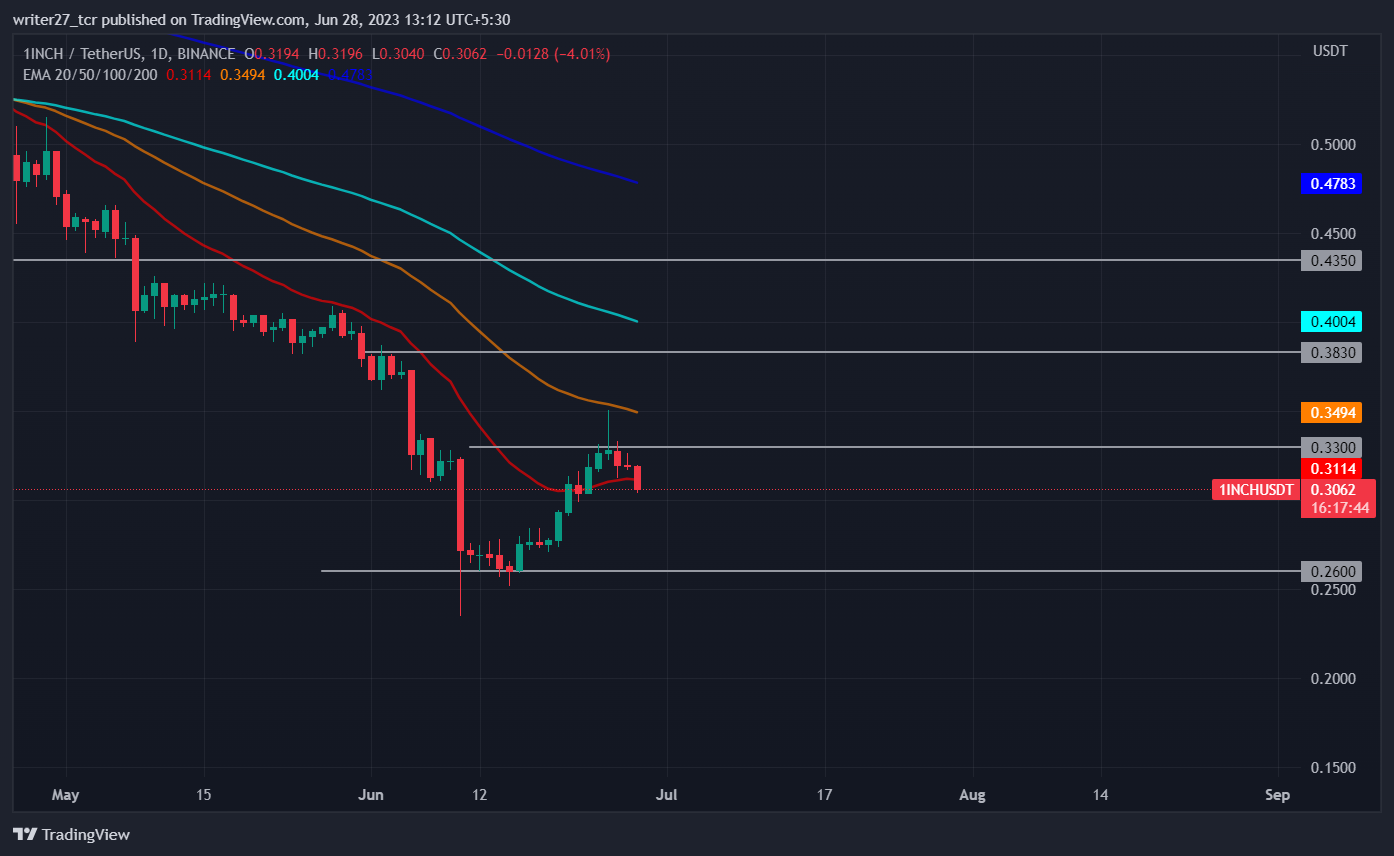
The current candle of 1inch is a strong bearish candle and is headed toward the recent support level of $0.26. The candle has already broken the lower wick of the previous candle. If the price is successful in breaking below the $0.30 level, there is a possibility that the price might head toward $0.28.
For price to regain bullish momentum, it needs to form a strong support. A break and close above $0.33 will help the price in filling the upper wick of the 25 June candle and in rising toward the next resistance level of $0.3830.
Will 1inch Price Melt Down to the $0.26 level?
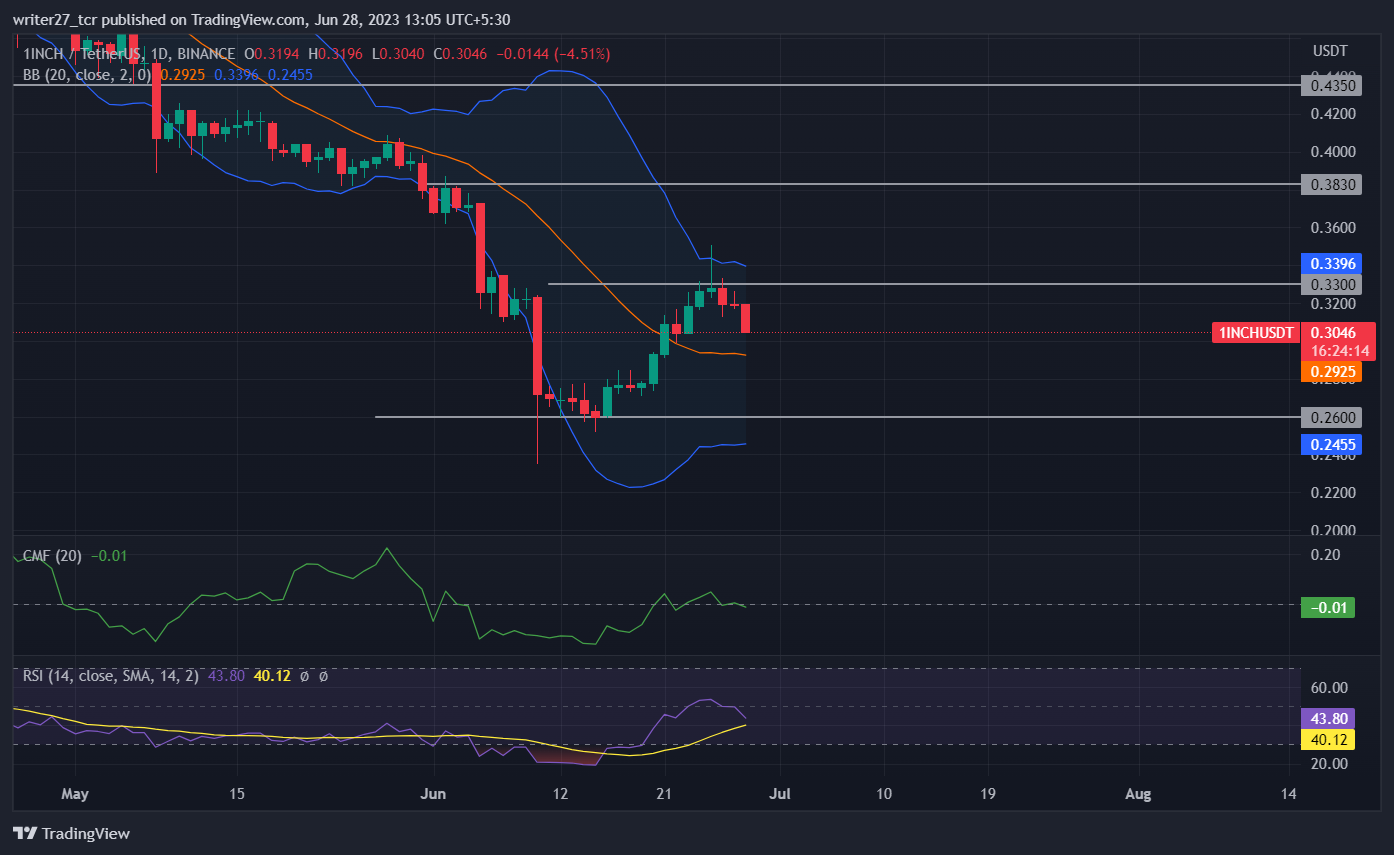
1inch price trades below the 20,50,100 and 200-day EMAs, indicating increasing bearish momentum in the price. Chaikin money flow score has dropped below 0 and is currently at -0.01, suggesting weakness in the market. Relative strength index (RSI) has dropped below 50 and is trading at 45.96, indicating rising bearish momentum.
The price faced strong resistance from the upper band of bollinger and is headed toward the lower band. If the 20-day SMA can sustain the price, there is a possibility of retesting the $0.33 level. The long/short ratio of 1inch is 0.90 with 47.58% longs and 52.42% shorts, indicating increased selling pressure in the last 24 hours.
Conclusion
The market structure and price action of 1inch has turned bearish after showing bullishness after 15 june. The price faced resistance from the $0.33 level and turned bearish to head toward the $0.26 level.
The 24-hour volume of 1inch is also down by 22.66% and the market capitalization is down by 2.45% to $290 million. The price has declined by 96.03% from the all-time high of $7.87 and is only up by 23.27% from its all-time low of $0.2535.
Technical levels
Major support: $0.26 and $0.24
Major resistance: $0.3830 and $0.33
Disclaimer
The views and opinions stated by the author, or any people named in this article, are for informational purposes only. They do not establish financial, investment, or other advice. Investing in or trading crypto assets comes with a risk of financial loss.

Andrew is a blockchain developer who developed his interest in cryptocurrencies while pursuing his post-graduation major in blockchain development. He is a keen observer of details and shares his passion for writing, along with coding. His backend knowledge about blockchain helps him give a unique perspective to his writing skills, and a reliable craft at explaining the concepts such as blockchain programming, languages and token minting. He also frequently shares technical details and performance indicators of ICOs and IDOs.


