
 Home
Home News
News
- 1 SOL coin is showing a bearish chart structure.
- 2 Bulls are struggling to gain momentum but facing rejection near $17.
Solana coin price may jump off the 20-day EMA mark near $17, which was a barrier in the past few trading sessions. Moreover, the chart structure still favors bears because sellers persisted in making short positions and tightening the price near the congestion zone.
The technicals of the coin show that SOL is near the demand zone of $12 and bounced from there in the past sessions as buyers accumulated. However, investors showed low interest, leading to a slow recovery rate, and the price stayed below the 20-day EMA.

Moreover, the price action suggests a further drop could retest the support range because of the selling pressure on the coin. Buyers attempted to take the lead, but the bears proved too strong for them, leading to a rejection.
As per the recent moves, SOL defended its support range near $11, ended its correction phase, made a strong base formation, and evaporated from there. However, sellers did not stay calm and were willing to break its recent lows of $11, which led to pressure on the bulls.
At the time of writing, SOL was trading at $16.20 with an intraday drop of 2.59% showing bearishness and seller dominance. Moreover, the intraday trading volume shows an increase of 4.73% to $327.67 Million. The pair of SOL/BTC is at 0.000537 BTC, and the market cap of SOL is $6.48 Billion.
Daily Chart Structure Favouring Sellers
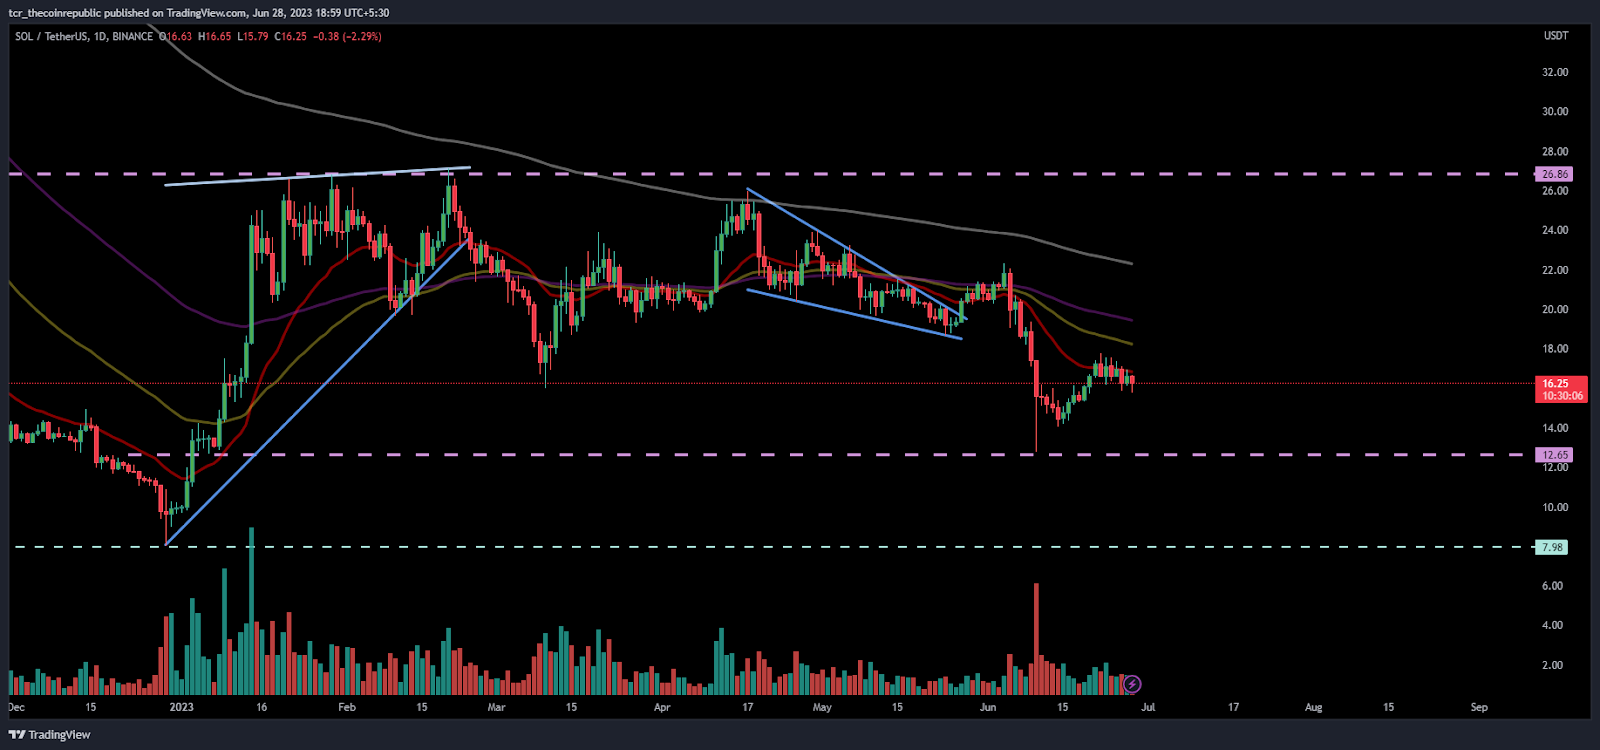
On the daily charts, SOL coin persists to form lower highs and lower lows without attaining buying momentum. From the supply range of $25 near the 200-day EMA, SOL continues to show a one-way drop and does not hold near the support, dragging below the key EMA and losing the gains.
Moreover, the lower volume was also a sign of short buildup activity, showing sellers’ attachment with the coin. Furthermore, the price is lingering near the mid-Bollinger band and is waiting for a direction to go further.
If SOL can sustain above the 20-day EMA, buyers would gain traction and will head toward the next hurdle of $20. On the other side, if further rejection is noted, the price will retest the support of $12.
Short Term Charts Shows Consolidation of SOL
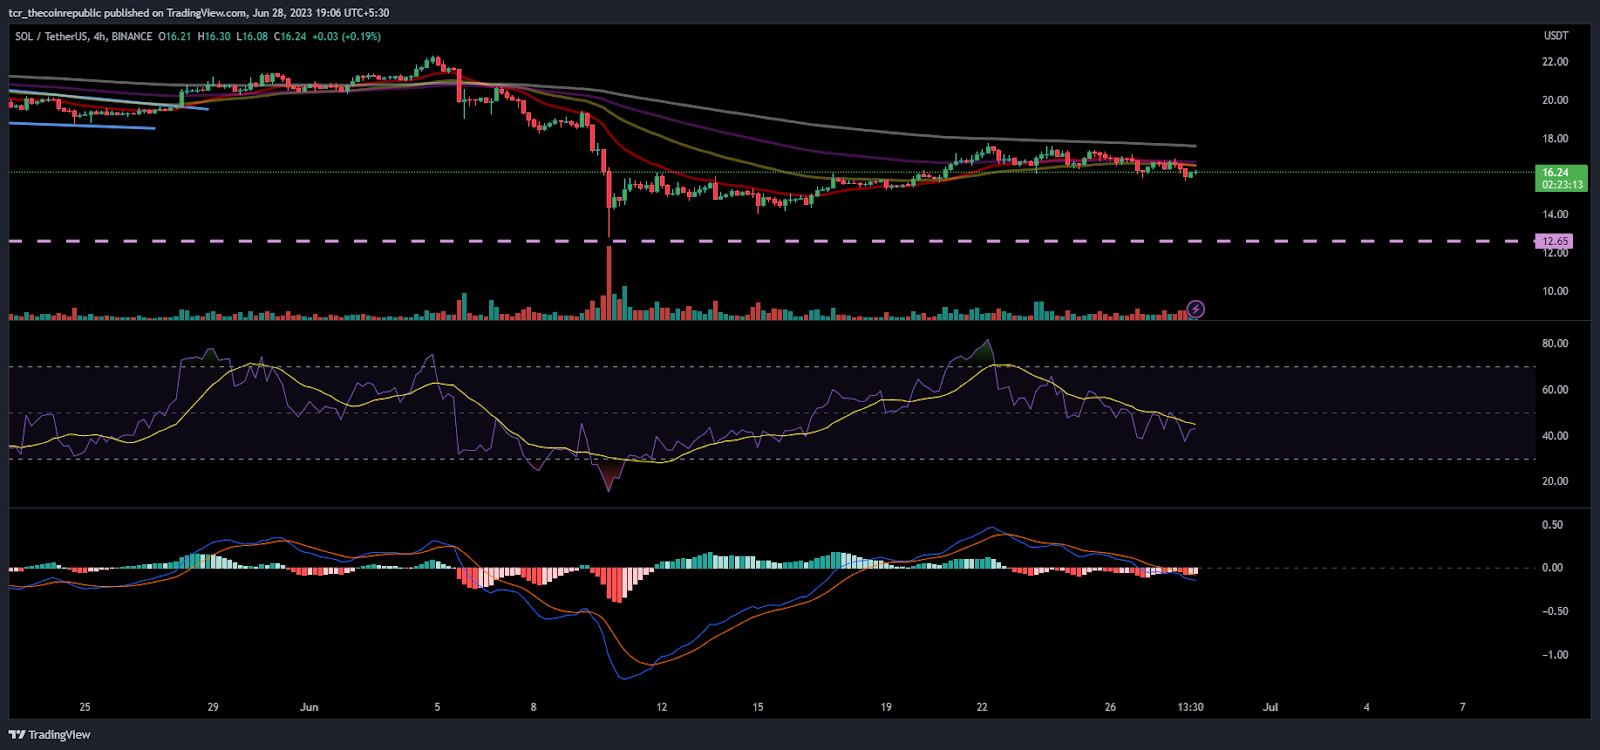
On the 4-hour chart, the Solana coin shows a consolidation move, trading in the congestion range, attempting to escape above the 20-day EMA. Moreover, the price stays in the range of neutrality, where sellers cannot force back further, as the price is getting a pause on the critical FIb level of 23.6%.
The RSI curve drops below neutrality, indicating a negative divergence and a weak chart structure favoring the seller.
The MACD indicator also persists in forming red bars on the histogram showing a bearish crossover from the previous sessions.
Conclusion:
Solana coin price is sustaining in a narrow range and is unlikely to surpass the 20-day EMA, hovering below the mark of $20.
Technical Levels:
Support Levels:$11
Resistance Levels:$20 and $25
Disclaimer
The views and opinions stated by the author, or any people named in this article, are for informational purposes only and do not establish financial, investment, or other advice. Investing in or trading crypto assets comes with a risk of financial loss.

Andrew is a blockchain developer who developed his interest in cryptocurrencies while pursuing his post-graduation major in blockchain development. He is a keen observer of details and shares his passion for writing, along with coding. His backend knowledge about blockchain helps him give a unique perspective to his writing skills, and a reliable craft at explaining the concepts such as blockchain programming, languages and token minting. He also frequently shares technical details and performance indicators of ICOs and IDOs.


