
 Home
Home News
News
- 1 Optimism price prediction suggests a decline in momentum of OP crypto over the daily time frame chart.
- 2 OP crypto has slipped below 20, 50, 100 and 200-days Daily Moving Averages.
- 3 The pair of OP/BTC traded at 0.00004062 BTC with an intraday drop of 1.62%.
Optimism price prediction indicates a fall in OP crypto inside the horizontal range-bound area over the daily time frame chart. OP crypto needs to surge toward the upper threshold to register its breakout. However, sellers have been pushing OP crypto toward the lower level of the consolidation phase. Optimism must escape the seller’s clutch in order to register its recovery phase.
Optimism price was at $1.237 and has gained 1.73% of its market capitalization intraday. However, trading volume fell by 3.85% in the day’s trading session. This demonstrates that sellers are getting involved in the trade to short OP cryptocurrency. The olume to market cap ratio was at 0.1301.

Optimism Price Prediction: Technical Analysis
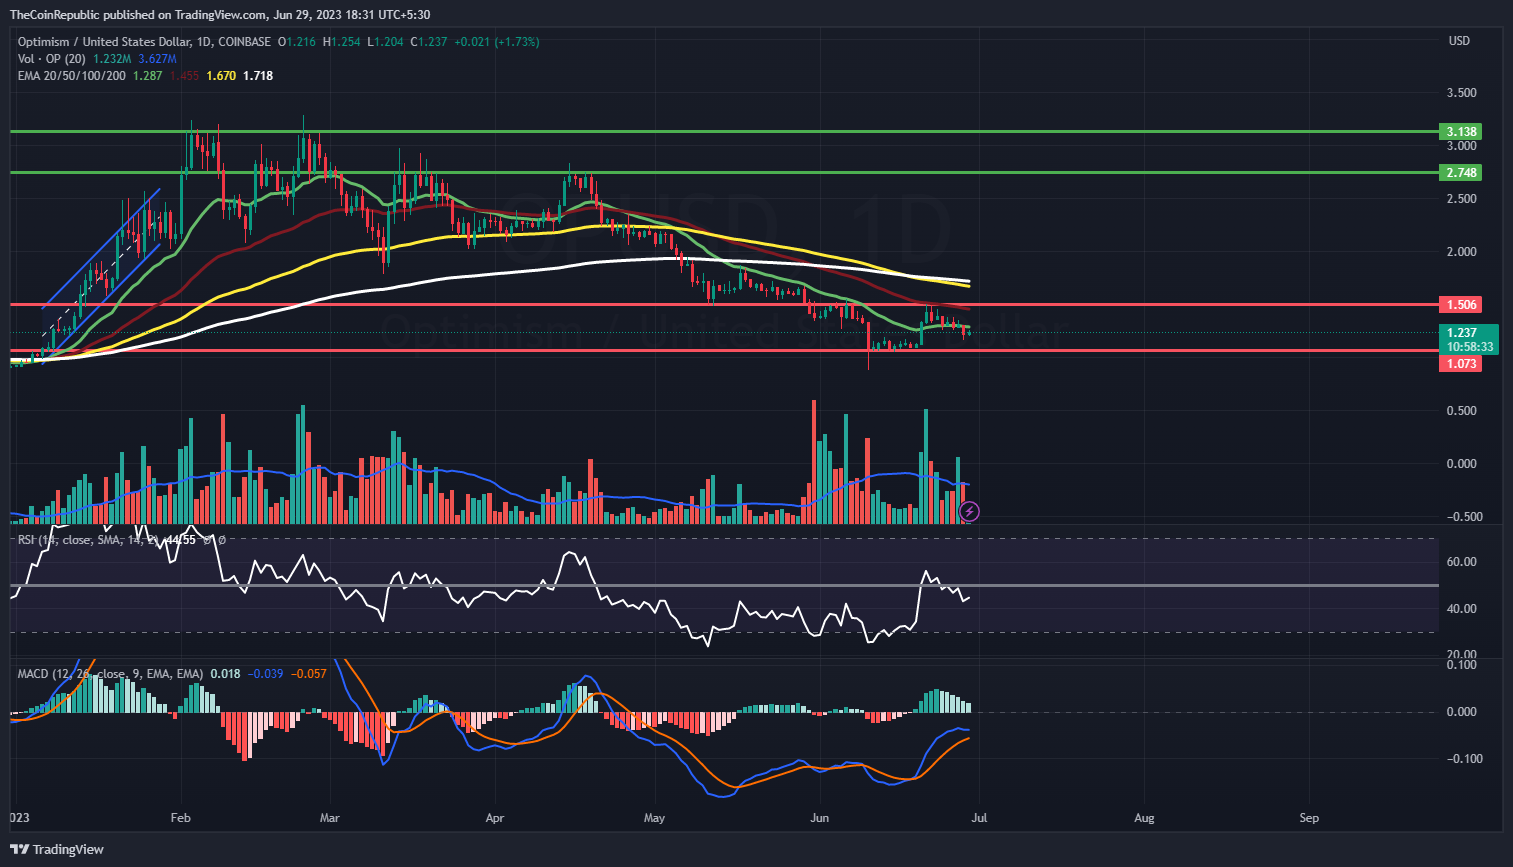
Optimism price prediction highlights the decline of OP cryptocurrency over the daily time frame chart. OP needs to attract more buyers in order to sustain and surge toward the upper threshold of the consolidation phase. Meanwhile, OP cryptocurrency has slipped below 20, 50, 100 and 200-days Daily Moving Averages.
Optimism price has gained around 36.36% in the last six months and 35.77% year to date. OP price may rise maximum during 2023 according to the analysts.
Technical indicators suggest an upward momentum in OP crypto. The Relative strength index showcases the upward momentum of OP. RSI was at 44 and is heading towards neutrality.
The MACD is also bullish on OP. The MACD line is above the signal line suggesting the OP crypto’s uptrend. Investors in OP crypto need to wait for any directional change over the daily time frame chart.
Summary
Optimism price prediction indicates the fall of OP crypto inside the horizontal range-bound area over the daily time frame chart. OP needs to attract more buyers in order to sustain and surge toward the upper threshold of the consolidation phase. Technical indicators suggest the uptrend momentum of OP crypto. Investors in OP crypto need to wait for any directional change over the daily time frame chart.
Technical Levels
Resistance Levels: $1.35 and $1.50
Support Levels: $1.15 and $1.00
Disclaimer
The views and opinions stated by the author, or any people named in this article, are for informational purposes only, and they do not establish financial, investment, or other advice. Investing in or trading crypto or stock comes with a risk of financial loss.
Mr. Pratik chadhokar is an Indian Forex, Cryptocurrencies and Financial Market Advisor and analyst with a background in IT and Financial market Strategist. He specialises in market strategies and technical analysis and has spent over a year as a financial markets contributor and observer. He possesses strong technical analytical skills and is well known for his entertaining and informative analysis of the Financial markets.


