
 Home
Home News
News
- 1 SNX price chart shows a range breakout above $2.000
- 2 The bulls were attempting to escape above 200-day EMA.
SNX token is trying to escape above the 200-day EMA but faces rejection and continues holding the gains near $2.200.The ongoing price action shows that the token bounced from the demand zone of $1.80 and retained the gains by breaking the neckline of the ascending triangle pattern above $2.00.
Moreover, SNX token is escaping from the sellers region and sustains in the neutral range, where the bulls are flexing their muscles and getting ready for a decisive move above the next hurdle of $2.500.
Furthermore, the token is taking immediate support on its 20-day EMA and continues gaining traction, showing the investors’ intent to accumulate from the dips. If bulls sustain above $2.300, momentum will get extended, and ongoing rally targets toward the next barrier of $2.500.
However, the price action indicated a fresh reversal from the support range of $1.800 and reverted again toward the key EMA. Moreover, the price is still in the buying range, where the bulls remained aggressive. The bulls tried to escape the 200-day EMA but were rejected in the last few trading sessions.
At the time of writing, SNX price is trading at $2.220 with an intraday gain of 9.58%. Moreover, the intraday trading volume noted an increase of 9.20% at $64.06 Million. Furthermore, the pair of SNX/BTC is at 0.000073 BTC, and the market cap is $721.18 Million.
Daily Charts Shows Bulls Rescuing Gains
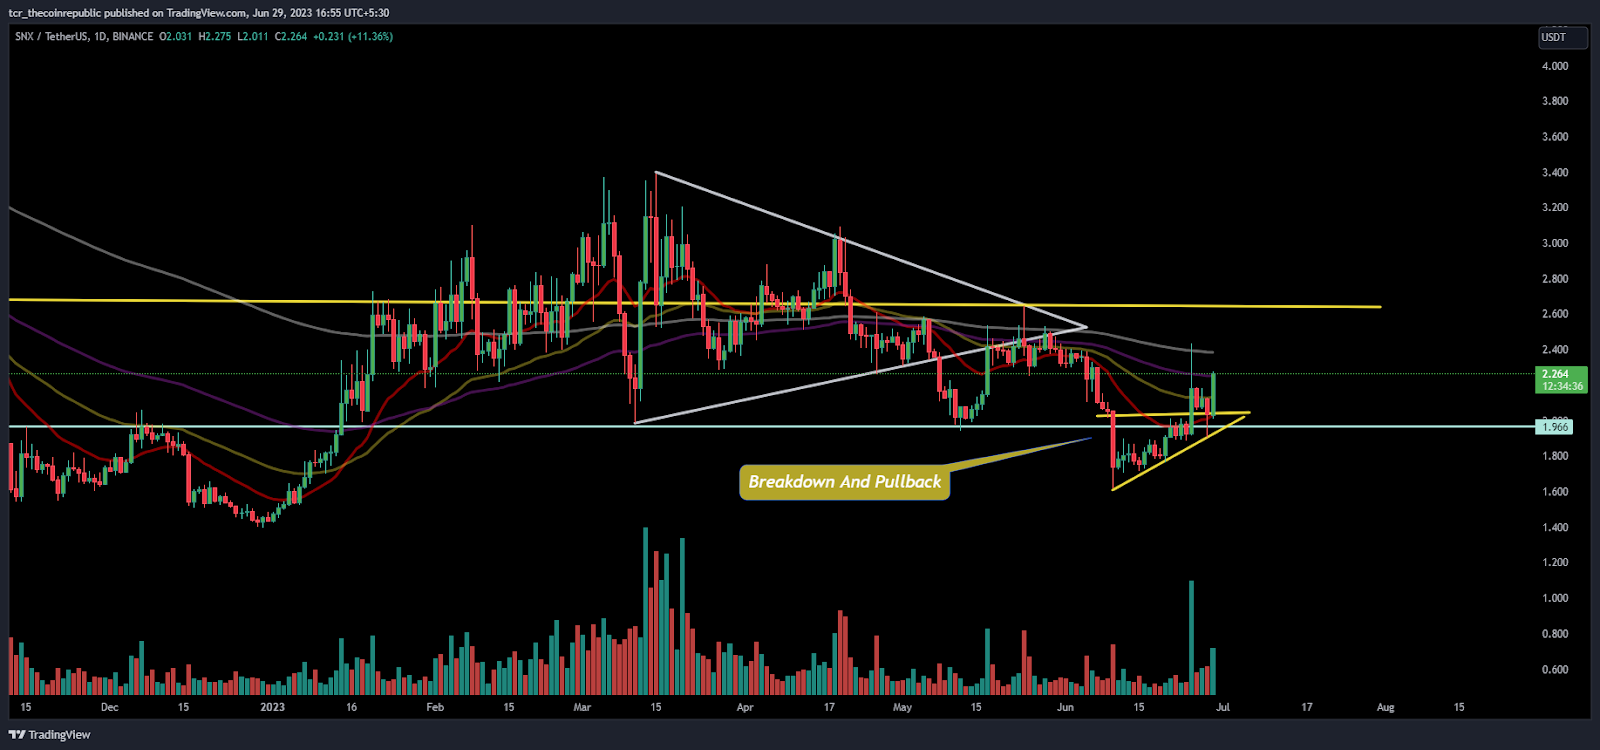
On the daily charts, SNX token broke out of the ascending triangle pattern and is trading above the neckline of $2.000.
Furthermore, the charts structure showed a bullish candle gaining by more than 9% intraday, which led to sellers being trapped and resulted in a massive short-covering rally on the charts.
Moreover, the price faces a barrier of 38.2% Fib level, a hurdle for bulls now. Bulls tried to escape the mark, but were rejected with an inverted hammer candle.
Short Term Chart Shows Range Breakout
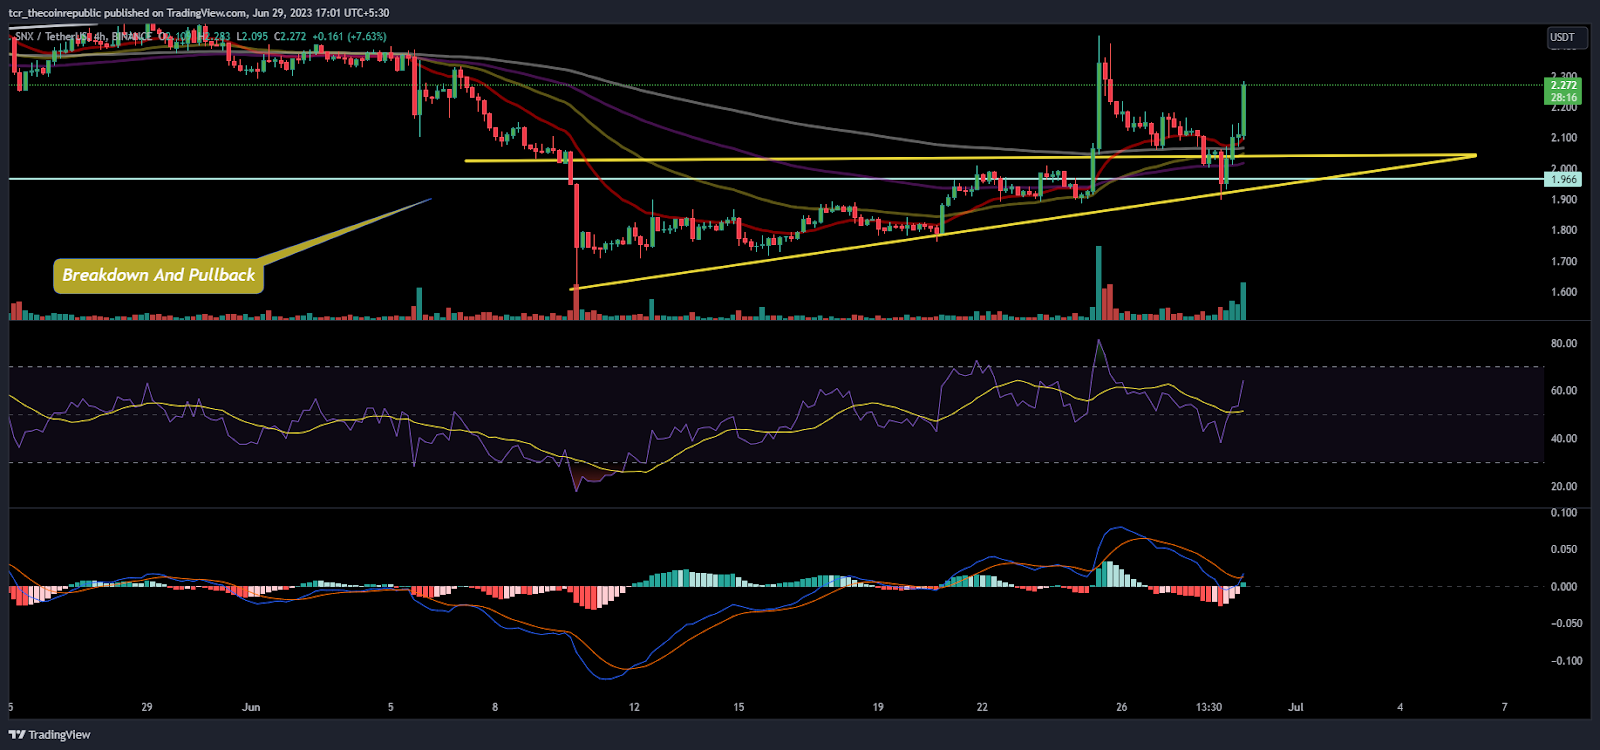
On the 4-hour chart, SNX token got close above the hurdle of $2.00 and made a bullish marubozu candle signalling the initiation of an uptrend. If further follow-on buying could arise from there and get cross above the 200-day EMA, then a massive bull run could be seen in the following sessions.
The RSI curve showed a rebound from the lows and is in the neutral range, forming a positive crossover, indicating bullishness on the charts.
The MACD indicator also shows green bars forming a bullish crossover offering a positive outlook.
Conclusion:
SNX token price is rebounding from its crucial support mark and crossing the round level of $2.000. The surge was obtained with a sharp volume spike.
Technical Levels:
Support Levels:$2.000
Resistance Levels:$2.500
Disclaimer
The views and opinions stated by the author, or any people named in this article, are for informational purposes only and do not establish financial, investment, or other advice. Investing in or trading crypto assets comes with a risk of financial loss.

Nancy J. Allen is a crypto enthusiast, with a major in macroeconomics and minor in business statistics. She believes that cryptocurrencies inspire people to be their own banks, and step aside from traditional monetary exchange systems. She is also intrigued by blockchain technology and its functioning. She frequently researches, and posts content on the top altcoins, their theoretical working principles and technical price predictions.


