
 Home
Home News
News
- 1 The price of Cosmos is currently trading near $8.8286 with an appreciation of 1.25% in the 24-hour trading volume.
- 2 Cosmos price is down by 5.84% over the last 7 days.
Cosmos price prediction suggests that ATOM price can see a further depreciation in its value. Cosmos price recently gave a bearish breakout to the descending triangle pattern with a strong bearish momentum. ATOM token is presently making a rally to take a retest from its immediate resistance level. It has a total supply of 346,608,690 which is 100% circulating in the market.
According to the technical indicators, ATOM price is trading firmly under the bears’ command. The Cosmos token may see a further decline in its value after breaking below the descending triangle on the daily chart though the descending triangle is a bullish pattern as it indicates the probability of a downtrend. Cosmos price recently retested the 50 EMA, but the price could not find buyers above and fell immediately.
Cosmos Price Prediction: Technical Analysis on Daily Chart
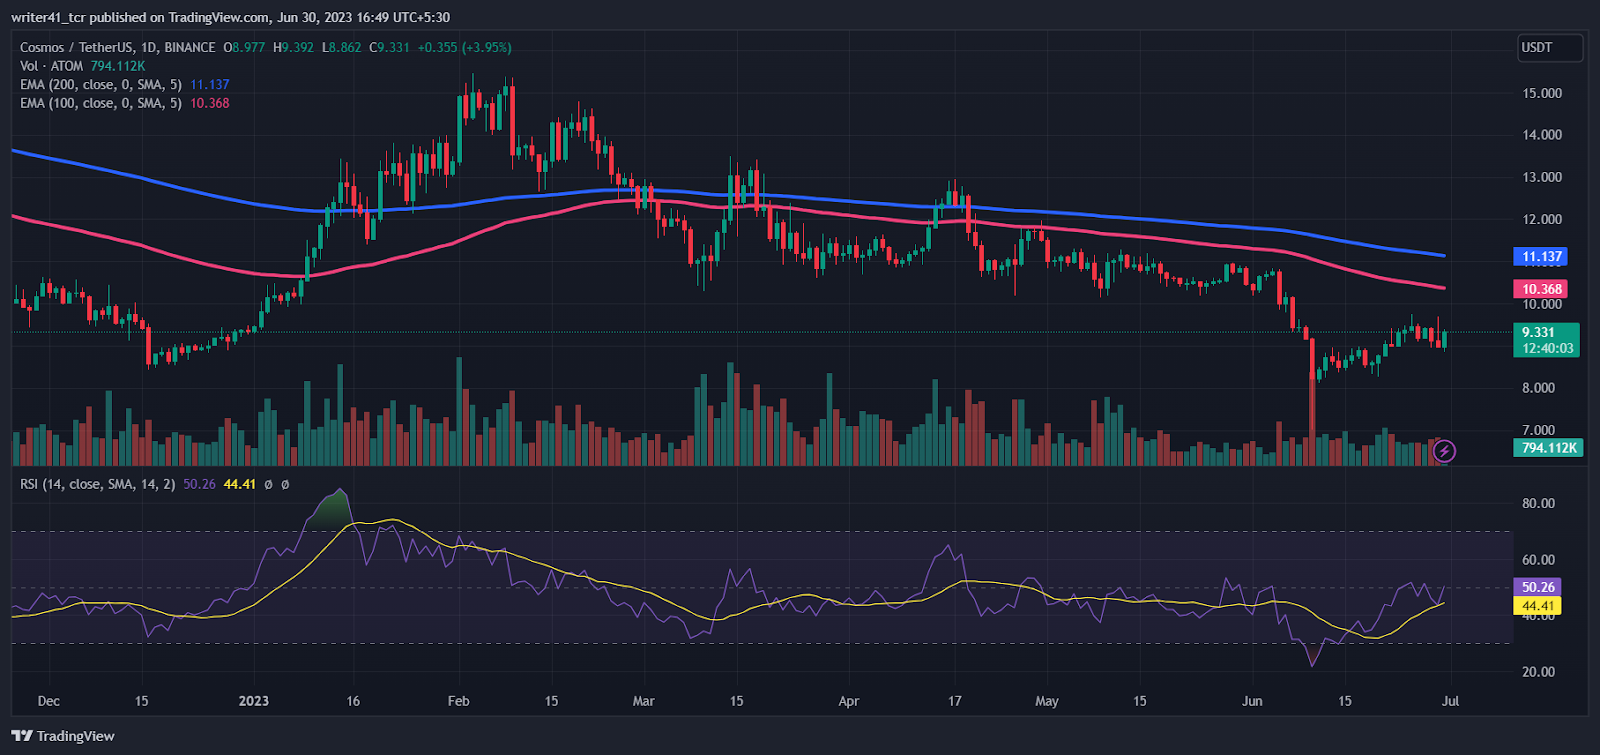
The price action suggests that Cosmos’s price may make a bearish correction shortly. It is presently trading below the major EMA levels. If the price fails to get the buyers’ support from the recent support level, it could fall by more than 25% shortly.
The RSI line is presently moving below its previous resistance level near the median line. The current RSI value of the Cosmos token is 47.20 points whereas the stochastic RSI is providing support to it at around 43.59 points.
Technical Analysis On Daily Chart Of Cosmos/BTC
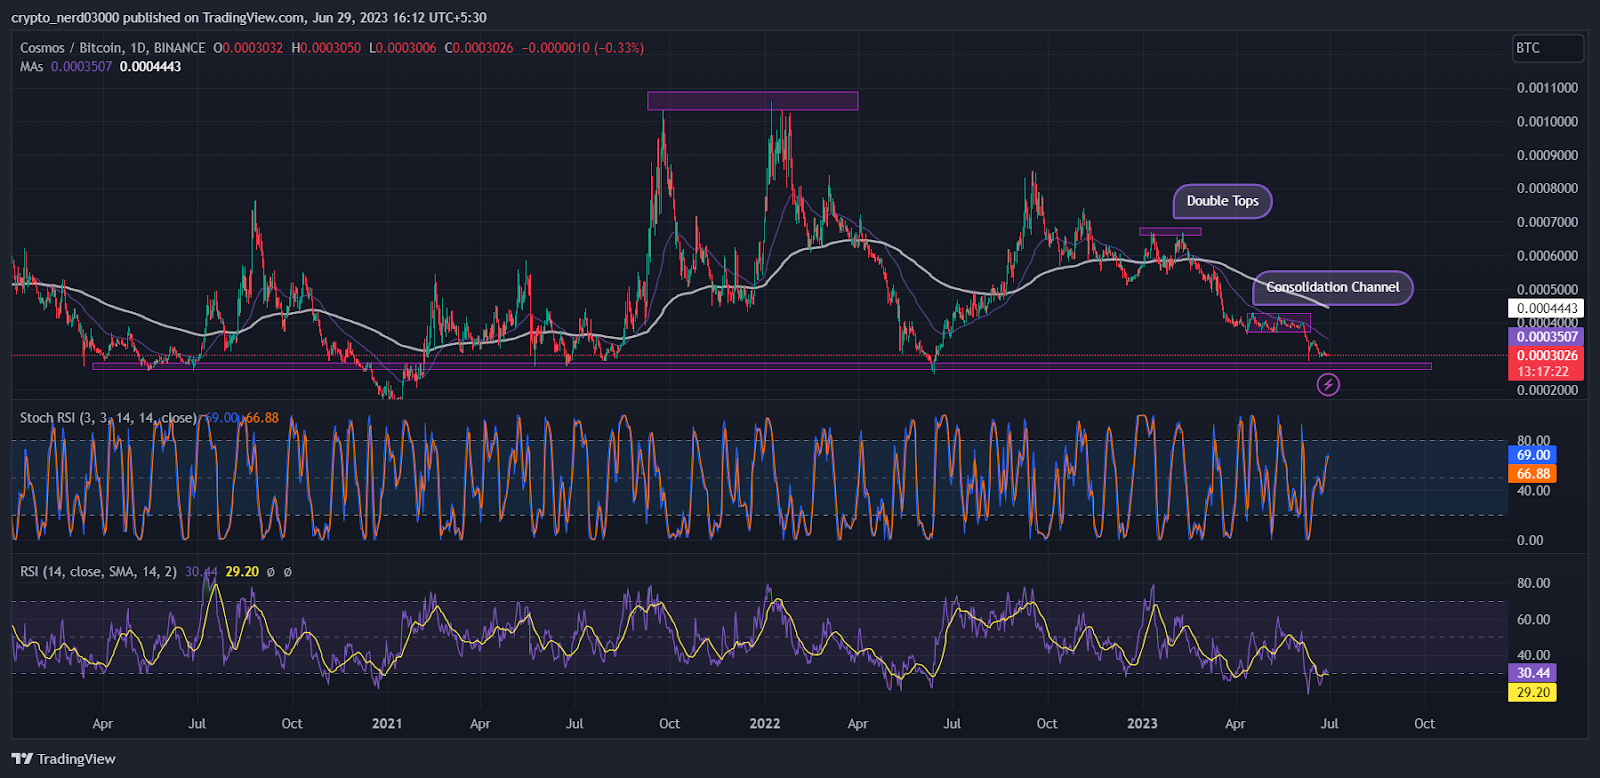
In contrast with the Cosmos/USDT pair, the Cosmos/BTC pair has reached its immediate support zone. Cosmos/BTC token is likely to make a bullish rebound as opposed to the Cosmos/USDT chart where the bears are entrenched.
Despite reaching the support level, Cosmos/BTC price is yet to give concrete bullish indications. Presently, it is moving below key EMA levels on the daily chart. Investors may prefer to wait for a positive reversal candlestick pattern such as doji or engulfing candle with the alignment of oscillators before making a decision.
Conclusion
According to the analysis, Cosmos price prediction suggests that the investors are currently under the bears’ influence on the daily time frame which may cause the buyers to step back from the price action.
Technical Levels:
Support – $8.000
Resistance – $12.000
Disclaimer
The views and opinions stated by the author, or any people named in this article, are for informational purposes only, and they do not establish financial, investment, or other advice. Investing in or trading crypto assets comes with a risk of financial loss.

Andrew is a blockchain developer who developed his interest in cryptocurrencies while pursuing his post-graduation major in blockchain development. He is a keen observer of details and shares his passion for writing, along with coding. His backend knowledge about blockchain helps him give a unique perspective to his writing skills, and a reliable craft at explaining the concepts such as blockchain programming, languages and token minting. He also frequently shares technical details and performance indicators of ICOs and IDOs.


