
 Home
Home News
News
NEO Coin price is moving bullishly, breaking multiple resistance levels decisively. The bullish marubozu candle formed in the intraday session led it by escaping above the key EMAs and is near the 200-day EMA.
Moreover, bulls are keen to break the swing hurdle of $10, which was the most critical range to escape where sellers maintained a firm grip. Furthermore, the battle is now at the most exciting stage, where, if the buyers succeed in escaping the range, the rally will extend, and more bullishness can be anticipated.
On the other hand, if the next candle drops below the 50-day EMA mark below $9.00, the price will again enter into the congestion zone, where it would sustain. The price action shows the bulls gaining traction with fresh long positions made by investors.
At the time of writing, NEO coin price is trading at $9.71 with an intraday gain of 10.30%. Moreover, the intraday trading volume noted an increase of 15.80% at $119.86 Million. Furthermore, the pair of NEO/BTC is at 0.000313 BTC, and the market cap is $684.38 Million.
Daily Charts Shows Battle Near the Trendline
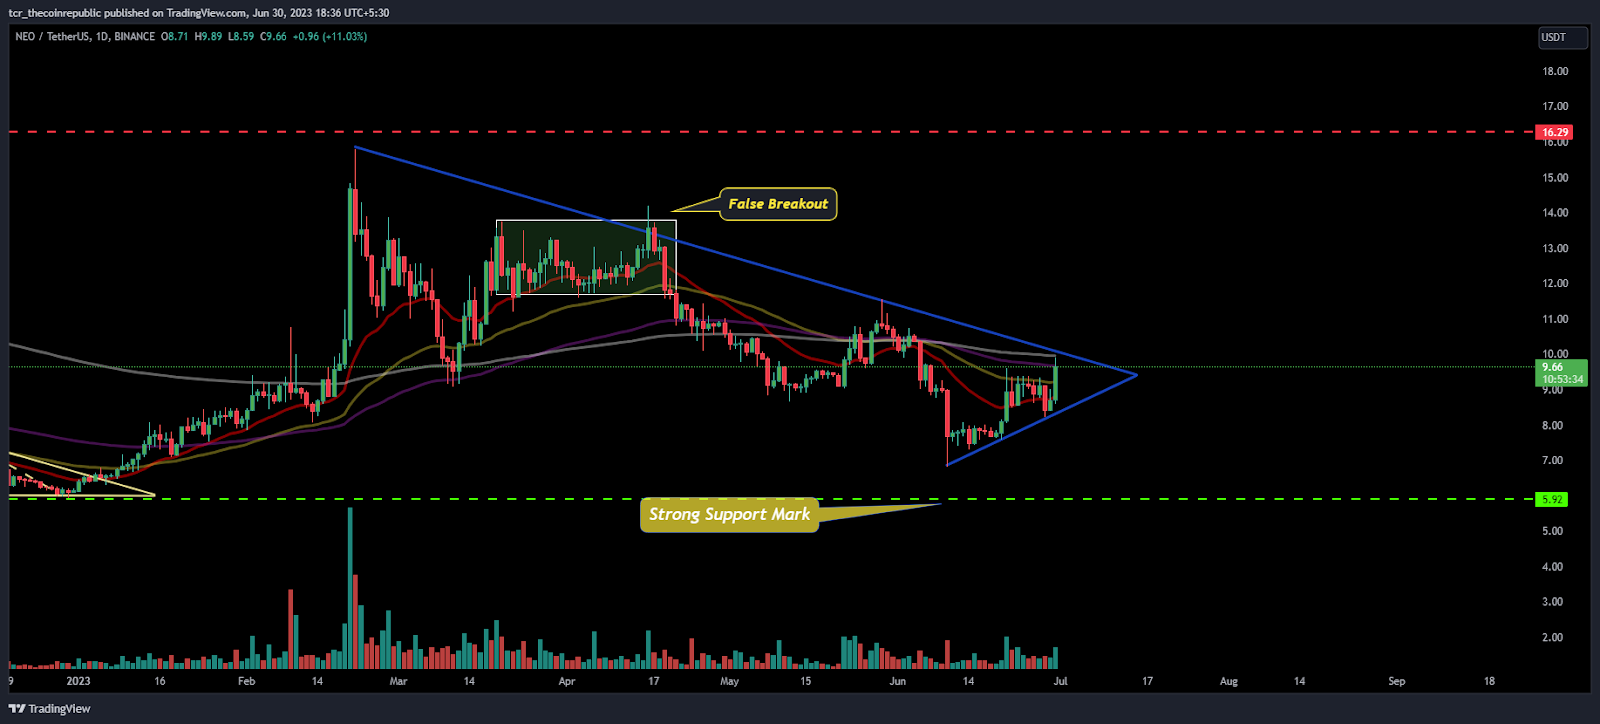
On the daily charts, NEO coin shows high volatility with the bulls defending its lower trendline and pulling back from the previous trading sessions. Moreover, the upper trendline acts as a barrier that, if broken, could set the stage for a future trend.
As per the Fib levels, NEO coin is near the 38.2% level, which exists near $10.20. The buyers are willing to test this level in the following sessions. However, above this level, the coin will attain neutrality and could turn into a trap for the sellers.
Short Term Chart Shows Range Breakout
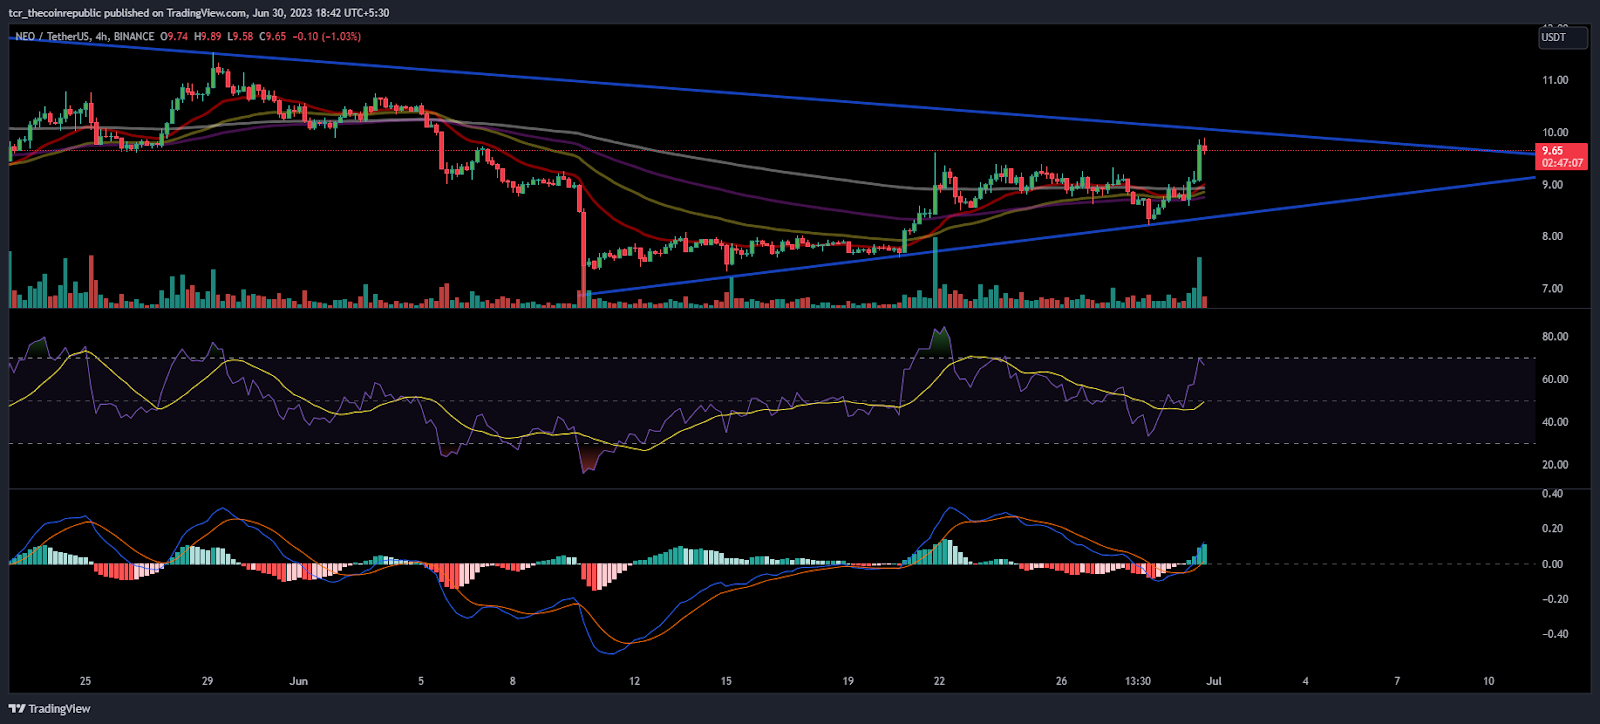
On the 4-hour chart, NEO coin broke out of the consolidation range with significant moves compared to the previous sessions. It showed the presence of investors with massive volumes on the chart. The break-out from the consolidation zone was cemented with a 10% gain, showing strong bullish interest.
The RSI curve showed a massive up-move, floating in the overbought zone near 70, and displayed a positive divergence.
The MACD indicator also indicates the same, plotting green bars on the histogram, showing a bullish crossover, indicating a positive outlook.
Conclusion:
NEO coin price is trying to attain momentum and is willing to retain the gains above the 200-day EMA, which is a hurdle now.
Technical Levels:
Support Levels:$9.00
Resistance Levels:$10 and $12
Disclaimer
The views and opinions stated by the author, or any people named in this article, are for informational purposes only and do not establish financial, investment, or other advice. Investing in or trading crypto assets comes with a risk of financial loss.

Andrew is a blockchain developer who developed his interest in cryptocurrencies while pursuing his post-graduation major in blockchain development. He is a keen observer of details and shares his passion for writing, along with coding. His backend knowledge about blockchain helps him give a unique perspective to his writing skills, and a reliable craft at explaining the concepts such as blockchain programming, languages and token minting. He also frequently shares technical details and performance indicators of ICOs and IDOs.


