
 Home
Home News
News

- 1 ANSS stock shows a rising parallel channel stretching the uptrend.
- 2 Bulls are ruling the uptrend and maintaining strong resilience over the top.
Ansys Share (NASDAQ: ANSS) price continued to lift the gains from the start of 2023 and bounced back from the support of $230. Moreover, the bulls defend the lower trendline multiple times and stretched the channel moving with the surge.

The ongoing price action shows that an inverted hammer candlestick was noted in the last session on the resistance mark of $330, which is a sign of rejection. Buyers are attempting to escape the range and get over the top near $350. However, sellers persisted in forcing bulls, but they had strong potential and pumped up decisively.

As per the stock technicals, there is a strong buy rating, and as per the price action and fundamentals, analysts gave a buy rating based on the price rally continuing to catch further highs as shown on the charts. Moreover, ANSS stock trades beyond the significant moving averages in the bullish territory extending the gains and flows in the uncharted range.
Ansys Inc. is a developing and marketing engineering simulation software company. The company is focused on developing open and flexible solutions that enable users to analyze designs directly on the desktop. The company’s product portfolio comprises ANSYS Workbench, Structures, Fluids, Electronics, Semiconductors, Multiphysics, Embedded Software, Systems, Three-Dimensional (3-D) Design, and Optical.
At press time, ANSS stock was traded at $330.27 with an intraday gain of 1.27% showing bullish cues in the last trading sessions. Moreover, the intraday trading volume increased by 5.78% to 575.834K. The market cap of ANSS stock is 28.622 Billion.
Will the ANSS Stock Price Go Above $330?
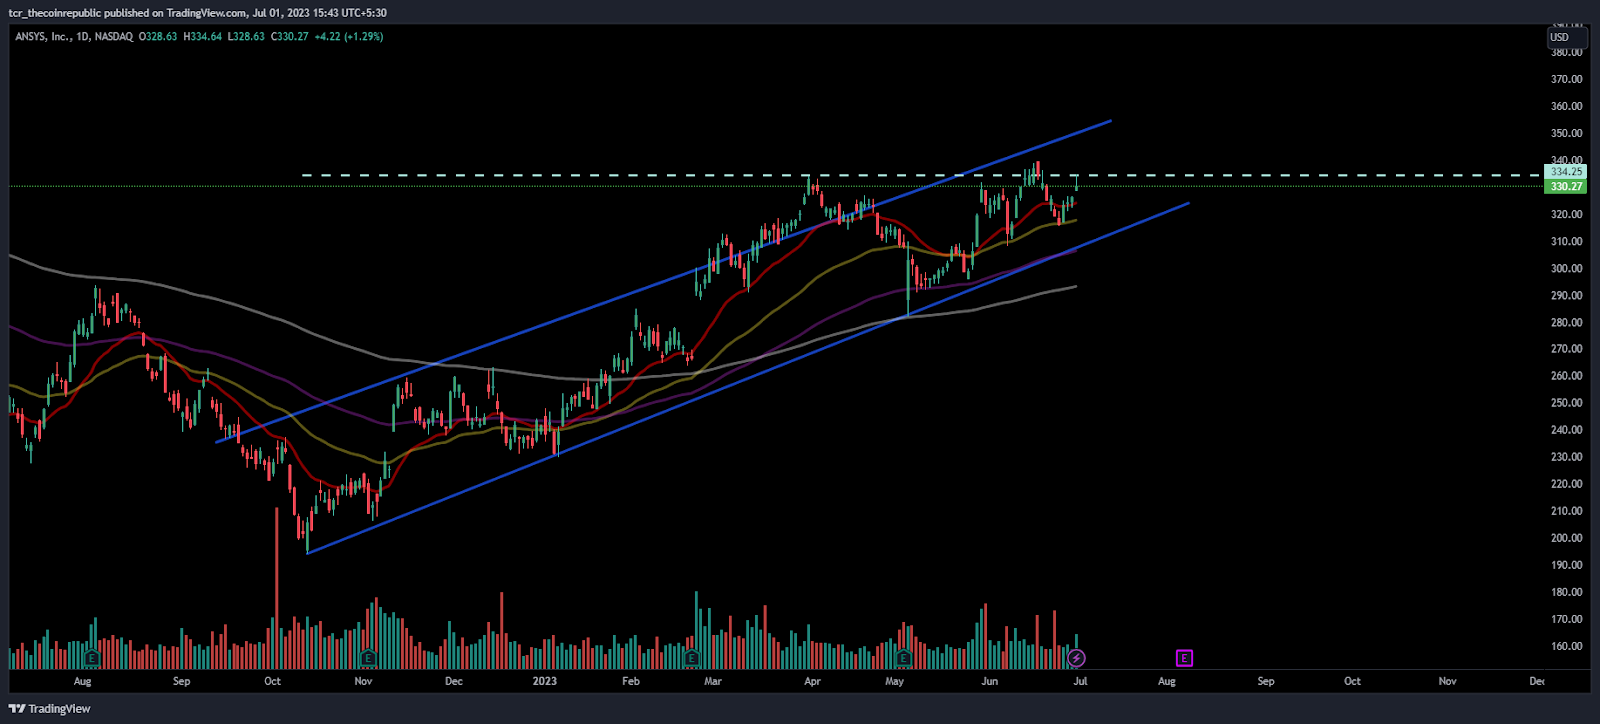
On the daily charts, ANSS maintains the bullishness, and trading over the top persists in holding the gains riding inside the rising parallel channel. Moreover, the rally trapped sellers in the past sessions, where buyers continued to make long positions and attempted to retest the round level of $350 in the upcoming sessions.
As per the Fib extension, ANSS stock price is near the 50% level, and the stock has a trajectory mark of $345, followed by $360 as per the indicator.
Short-Term Charts Shows Buyers’ Dominance
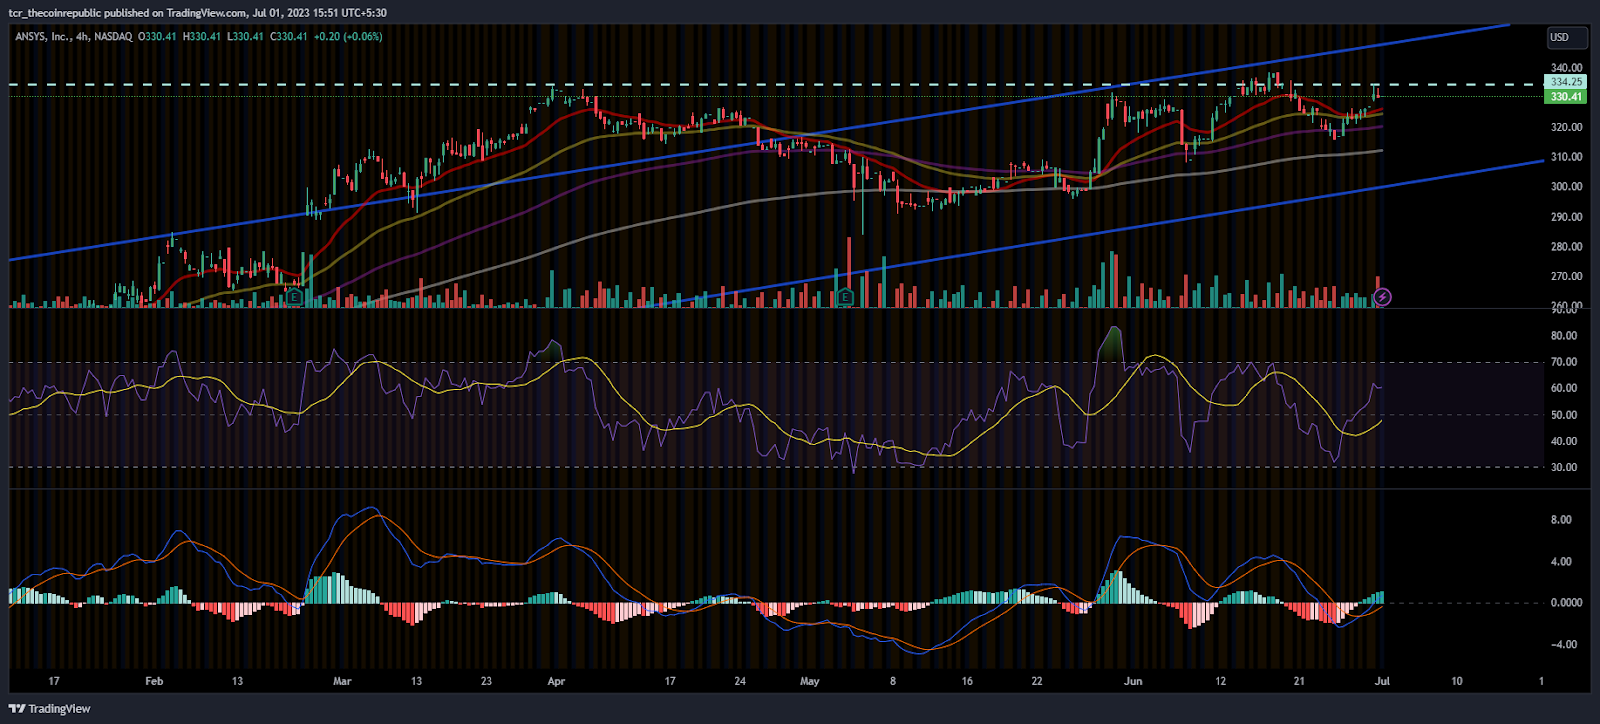
On the 4 hours chart, ANSS stock is forming a volatile chart structure, pausing near the immediate hurdle of $330 and waiting for a pump above it. At the same time, sellers raised and tried to flip the trend and force bulls.
The RSI curve is near 65, staying in the overbought zone, forming a positive crossover, and showing bullishness over the top.
The MACD indicator also persists in forming green bars on the histogram and maintaining the gains trading inside the rising parallel channel.
Conclusion:
ANSS stock traded above the 20-day EMA, showing a positive outlook but waiting for a further breakout above the hurdle of $340 to extend the ongoing trend.
Technical Levels:
Support Levels: $320
Resistance Levels: $345 and $360
Disclaimer
The views and opinions stated by the author, or any people named in this article, are for informational purposes only and do not establish financial, investment, or other advice. Investing in or trading crypto assets comes with a risk of financial loss.

Nancy J. Allen is a crypto enthusiast, with a major in macroeconomics and minor in business statistics. She believes that cryptocurrencies inspire people to be their own banks, and step aside from traditional monetary exchange systems. She is also intrigued by blockchain technology and its functioning. She frequently researches, and posts content on the top altcoins, their theoretical working principles and technical price predictions.


