
 Home
Home News
News

- 1 ETC price chart shows accumulation; the price level bounced from the support of $17.
- 2 Bulls are pumping gains, smashing above the major EMA level.
The ETC coin price chart showed bullish cues. The price escaped above the 200-day EMA indicating that bulls retained shape and accumulated it from the support zone. Moreover, the price sustained above the $20 mark showing that it has recovered from the lows by retesting the $15 mark.
Furthermore, buyers are gaining momentum, and the trading volume was also a sign of conviction that investors are now getting interested in ETC as fresh long positions are made.

The coin’s trajectory suggests that if ETC sustains above its 200-day EMA, it will begin an uptrend and will head to the neckline of $25, the hurdle for bulls. If the price slips below $20, the downside is capped until $15.
In the previous sessions, ETC was in a consolidation range, and a breakdown was noted, which led to the corrective move of the coin; it retested the $13 level, but a rejection candle stopped it from moving ahead. Afterward, the price reverted from there and gained traction, leading to a recovery.
At the time of writing, ETC was trading at $21.23 with an intraday gain of 3.00% showing bullish indications. Moreover, the pair of ETC/BTC is at 0.000692 BTC, and the intraday trading volume increased massively by 25.60% to $1.19 Billion. The day high of ETC is $23.20, and the day low is $18.97. The market cap of ETC is $3.01 Billion.
Daily Charts Shows Price Surge With Volume Spike
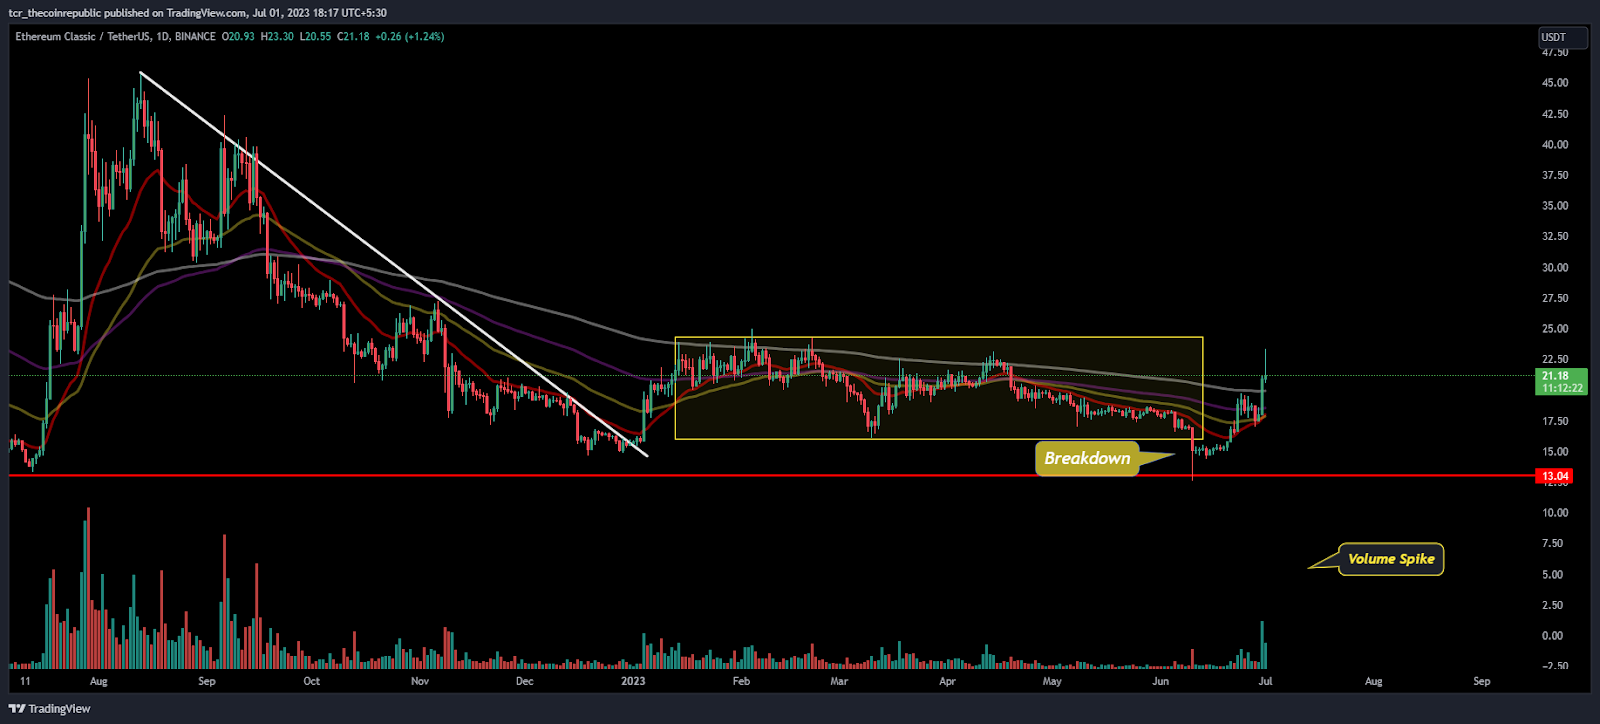
On the daily charts, ETC coin shows bullish moves, escaping the key moving averages, indicating strength on the charts. Furthermore, the price is entering the buying range, and sellers were trapped in the last sessions.
Based on the follow-on buying above the 200-day EMA, it was a clear sign that buyers had the strength and attained massive momentum leading to an enormous move.
Short Term Charts Shows Range Breakout
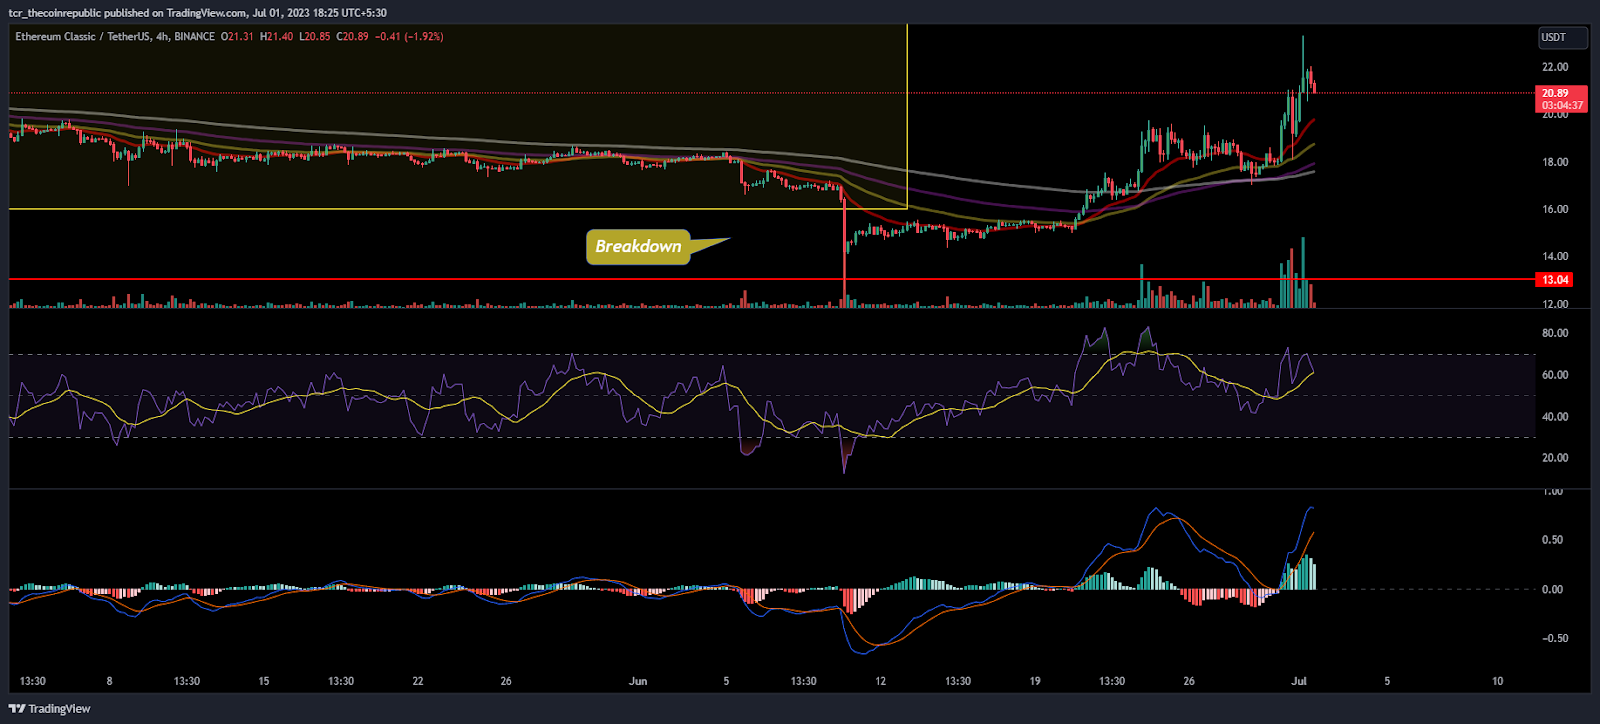
On the 4 hours chart, ETC coin broke out of the consolidation zone and ended the correction phase by entering the buying region. However, the inverted hammer candlestick showed signs of rejection, and sellers rose booked profits, leading ETC to slide from the $21 level.
The RSI curve stayed over the top near 70 showing positive divergence and indicating the bullishness on the coin chart.
The MACD indicator also showed massive green bars on the histogram showing enormous buying in the previous trading sessions.
Conclusion:
ETC is now trading above the 200-day EMA and is willing to retest the neckline near $25 in the following sessions.
Technical levels;
Support Levels: $16
Resistance Levels:$25
Disclaimer
The views and opinions stated by the author, or any people named in this article, are for informational purposes only and do not establish financial, investment, or other advice. Investing in or trading crypto assets comes with a risk of financial loss.

Andrew is a blockchain developer who developed his interest in cryptocurrencies while pursuing his post-graduation major in blockchain development. He is a keen observer of details and shares his passion for writing, along with coding. His backend knowledge about blockchain helps him give a unique perspective to his writing skills, and a reliable craft at explaining the concepts such as blockchain programming, languages and token minting. He also frequently shares technical details and performance indicators of ICOs and IDOs.


