
 Home
Home News
News
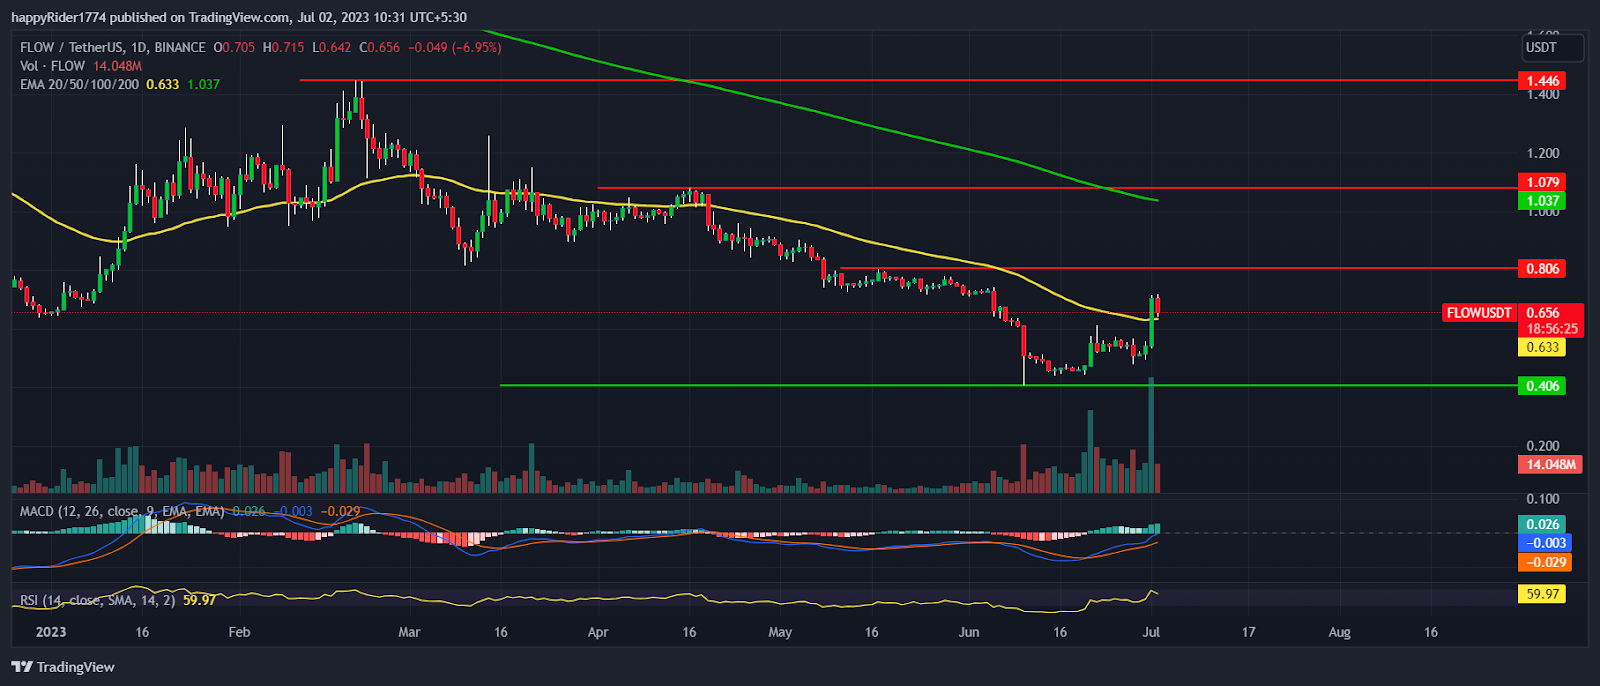
- 1 Flow price soars 30% in a single day and climbed above the 50 day EMA.
- 2 Flow Price Prediction is turning bullish and is likely to regain the $1.00 mark.
- 3 FLOW crypto price took a sharp U-turn and recovered 75% from the recent low at $0.400.
FLOW price surged 30% in a single day and showed initial signs of a bullish trend reversal. It showed a sharp recovery of 75% from the recent low and formed a bullish reversal pattern.
Flow price successfully climbed above the 50 day EMA indicating that the buyers are active at the lower levels and are returning back on track. The buying volume increased rapidly and prices also followed the same direction. It denotes that either Flow crypto price is oversold and is giving a temporary pull back or some genuine investors have turned bullish. If the price holds the 50 day EMA, then positive momentum might continue for some more time.
The 200 day EMA is still downward sloping and placed near $1.00 which will act as a strong hurdle for the bulls. For the past few months, FLOW price has not performed well and stayed in correction mode.
The downfall halted near $0.400 and a short term pull back has created positive hopes for long term investors. Flow price is trading at $0.656 with an intraday decline of 6.95%. The 24-hour volume to market cap ratio is 56.58%.
Will Flow Price Regain $1.00 in the Pull Back?
Flow Price Prediction is tuning bullish and might perform well in the long run. Bitcoin price holds at $30K, spreading the positive waves in the market. It indirectly impacts the market sentiment as well as the prices of Altcoins.
Flow Price is racing toward the crucial resistance at $0.800. If the buyers succeed to break out of $0.800, then the path toward $1.00 will open. However, if the FLOW crypto faces rejection from $0.800, then it is expected to remain in the consolidation range between $0.400 and $0.800.
The technical analysis suggests that the FLOW crypto price chart will now begin to show a recovery phase and that. Flow price will gain momentum when the buyers are able to regain the $1.00 level and sustain.
FLOW Price Turning Bullish on Bigger Time Frames
FLOW price broke out of the previous week high which indicates that the bullishness persists on multiple time frames. The sudden rise in the volume shows money is injected in Flow crypto and it will be difficult to pull the prices down to the lows.
The MACD curve has generated a positive crossover and the curve is sloping upward indicating bullishness. The RSI at 58, near the neutral territory denotes an equal level of tug of war and a balance between bullish and bearish positions.
Conclusion
FLOW price surged by 30% and displayed signs of a bullish trend reversal. The reversal will be confirmed when buyers are able to break out of the $0.800 hurdle. The technical analysis suggests, the recent upward movement in FLOW crypto looks reliable and more upward momentum is possible.
Technical levels
Resistance levels: $0.800 and $1.000
Support levels: $0.400 and $0.200
Disclaimer
The views and opinions stated by the author, or any people named in this article, are for informational purposes only. They do not establish financial, investment, or other advice. Investing in or trading crypto assets comes with a risk of financial loss.

Andrew is a blockchain developer who developed his interest in cryptocurrencies while pursuing his post-graduation major in blockchain development. He is a keen observer of details and shares his passion for writing, along with coding. His backend knowledge about blockchain helps him give a unique perspective to his writing skills, and a reliable craft at explaining the concepts such as blockchain programming, languages and token minting. He also frequently shares technical details and performance indicators of ICOs and IDOs.


