
 Home
Home News
News
- 1 Harmony is currently trading at $0.01262 while seeing a fall of 15.63% in the 24-hour trading volume.
- 2 Harmony price recorded a fall of 3.82% over the last 7 days.
Harmony price prediction suggests that ONE token is attempting to make a bullish recovery. The price of Harmony is currently attempting to make a retest from its previous support level. A breakout through the resistance zone has low probability as it is backed up by the 50 EMA which is acting as a formidable barrier below the 100 EMA.
Harmony presents an open infrastructure for 10 Billion people in the future. Harmony creates a high-performance consensus platform that will allow everyone to access a decentralized economy. The current value of ONE token is $0.0126, it has declined by 4.1 within the last 7 days.

Decrease In LunarCrush Levels Regarding Harmony
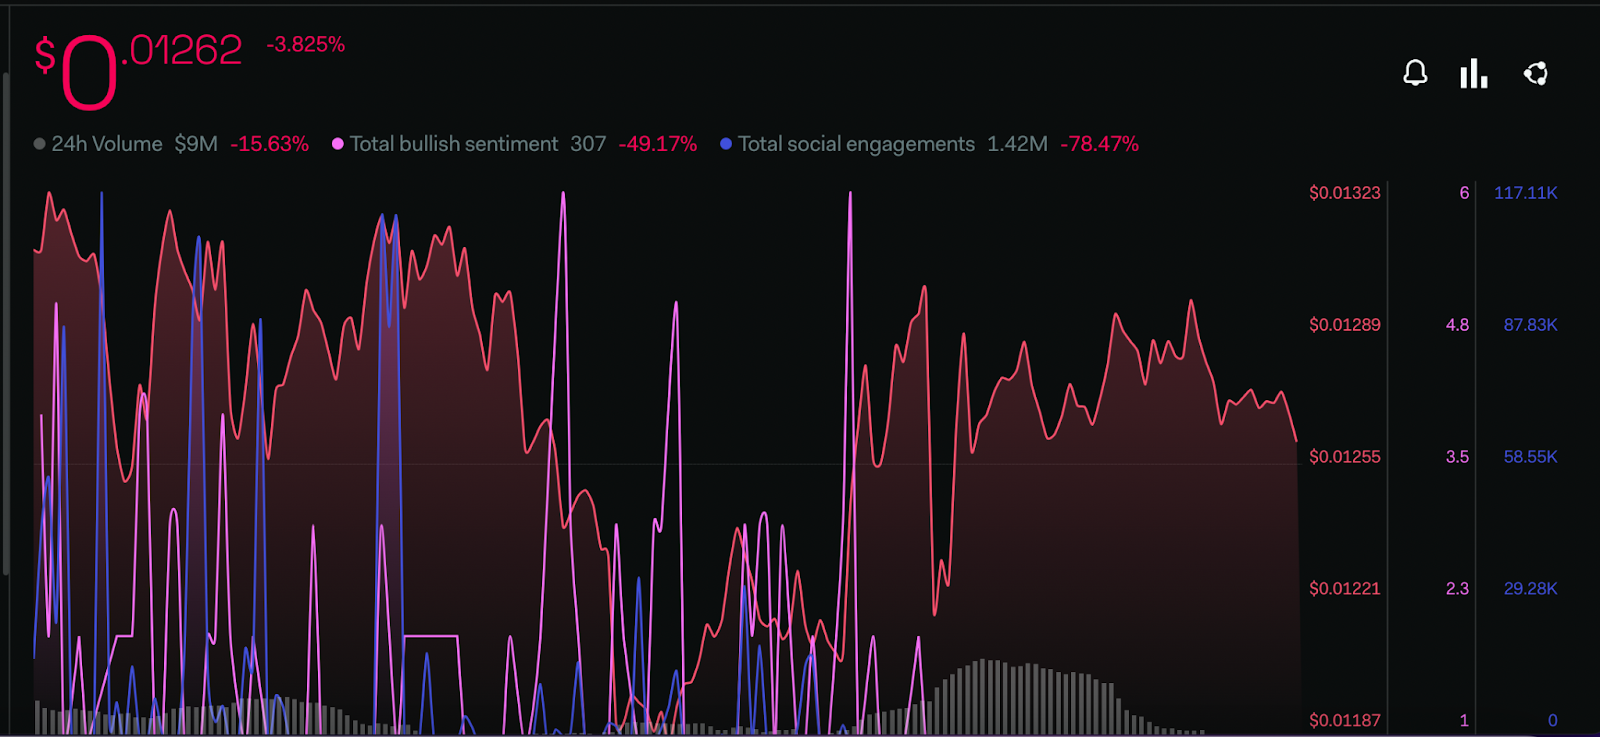
There is a sharp decline in most of the parameters in the LunarCrush platform. The total bullish sentiment metric has declined by 49.17%. There is a 78.45% fall in the total social engagement level which suggests that the community is not very optimistic regarding the token at present.
Major Hike In Greed Sentiment Of Investors

Investor sentiments regarding the overall cryptocurrency market have surged significantly. The market’s sentiment metric leaped by 16 points since last week when the index was moving near 49 points.
The present value of the sentiment index is 64 points in the greed zone as per Alternative(dot)me.
Harmony Price Prediction: Technical Analysis On 1-Day Chart

The RSI line is moving near the median line on a daily time frame. The present value of the RSI is 49.10 points and the value of 14 SMA is 48.06 points. The RSI line is suggesting that ONE price can take a positive turn if it succeeds in breaking above the median line.
At present, the stochastic RSI has reached the overbought level and the value of the stochastic RSI is 97.56 points as opposed to the RSI oscillator. The stochastic RSI is making another positive crossover between the %K and %D line near the supply zone on the 1-day chart.
Conclusion
According to the analysis, the buyers are attempting to take control back of the Harmony chart. The RSI and stochastic oscillators are trading near their respective resistance levels though there is a slight possibility that ONE token may make a recovery. Investor sentiments regarding the overall cryptocurrency market have surged significantly.
Technical Levels:
Support –$0.01000
Resistance – $0.03000
Disclaimer:
The views and opinions stated by the author, or any people named in this article, are for informational purposes only, and they do not establish financial, investment, or other advice. Investing in or trading crypto assets comes with a risk of financial loss.

Andrew is a blockchain developer who developed his interest in cryptocurrencies while pursuing his post-graduation major in blockchain development. He is a keen observer of details and shares his passion for writing, along with coding. His backend knowledge about blockchain helps him give a unique perspective to his writing skills, and a reliable craft at explaining the concepts such as blockchain programming, languages and token minting. He also frequently shares technical details and performance indicators of ICOs and IDOs.


