
 Home
Home News
News
- 1 Metlife Inc. stock price closed at 56.63 with a gain of 0.62% during the intraday session.
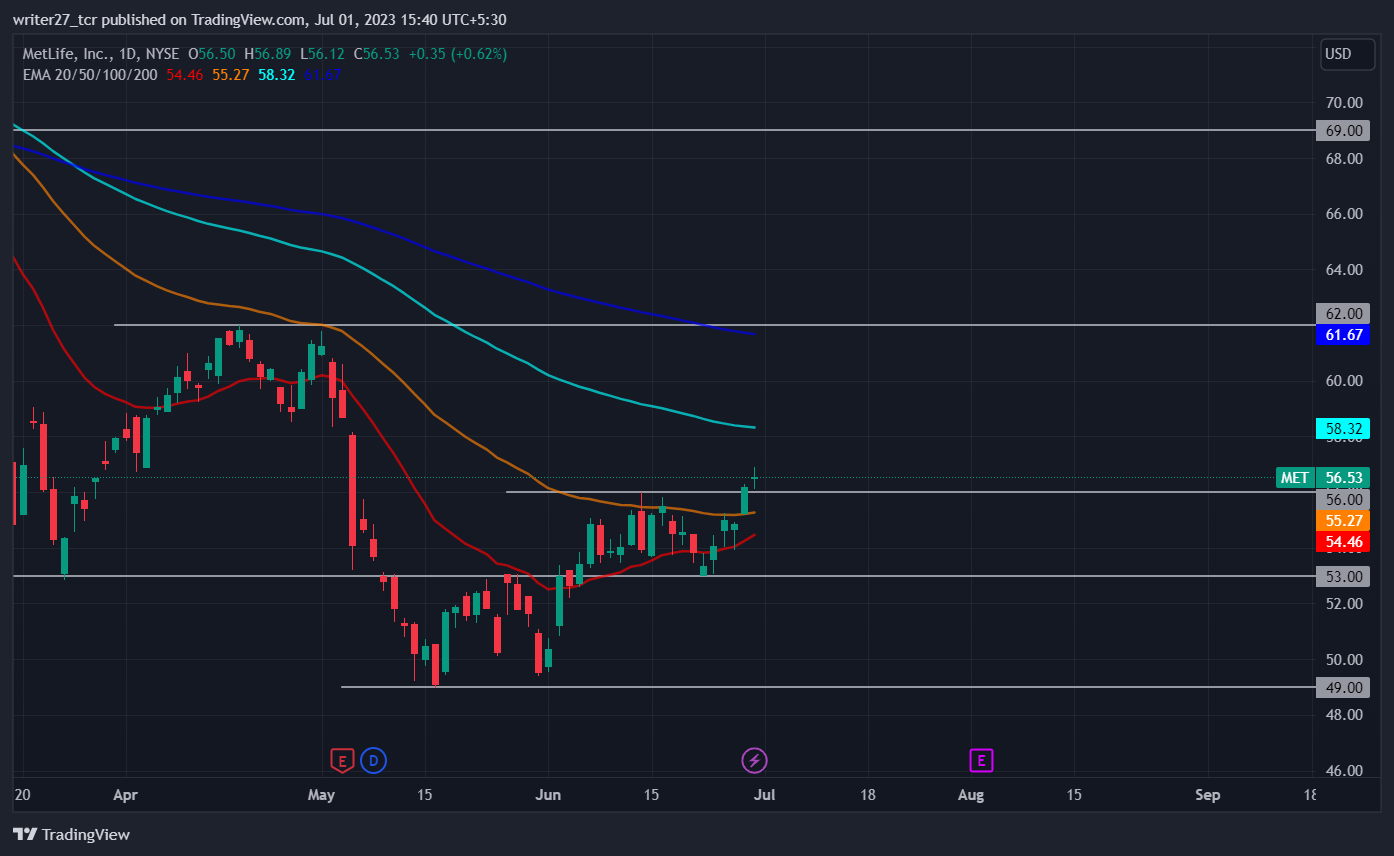
- 2 Met stock price rises above 20 and 50-day EMAs.
- 3 One month’s return of Metlife Is 10.95% while the year-to-date return is -21.96%.
During the start of 2023, Met stock price entered into a consolidation zone ranging between $69 and $73 which went on till March 2023. As March started, bears took control of the price and shattered the support level of $69.
The price already took a hit as soon as the Q4 of 2022 results were announced. The results were not positive. The company could not beat the consensus estimates of revenue as well as the earning per share which induced a bearish sentiment in the price. The drop in March 2023 caused a loss of roughly 23% in the price.
The stock price then formed a support at $53 and bounced off toward $62 but the move could help the price rise above $62. Met stock price again fell and broke the recent support of $53.
The stock price plummeted 19.2% in May 2023 due to unsatisfactory first-quarter earnings results. The company generated a revenue of $15.38 Billion while consensus estimated it to be $16.84 Billion. The net income was $80 Million and a year ago, the company reported a net income of $669 Million. The earning per share was estimated to be $1.81 and the company reported $1.52, a surprise of -0.294 (16.22%).
Recently, the price has started to recover from the losses after the formation of support at the $49 level. The stock price is up 14% in June 2023.
MET stock price was stuck in a narrow consolidation zone ranging between $53 and $56 but the previous candle finally did a breakout and closed above $56. If the bullish momentum prevails, there is a possibility that the price might head toward $62 causing a rise of roughly 9% in the price. One week’s gain in Metlife stock price stands at 6.64%.
Will MET Stock Price Retest at $62 Next Week?
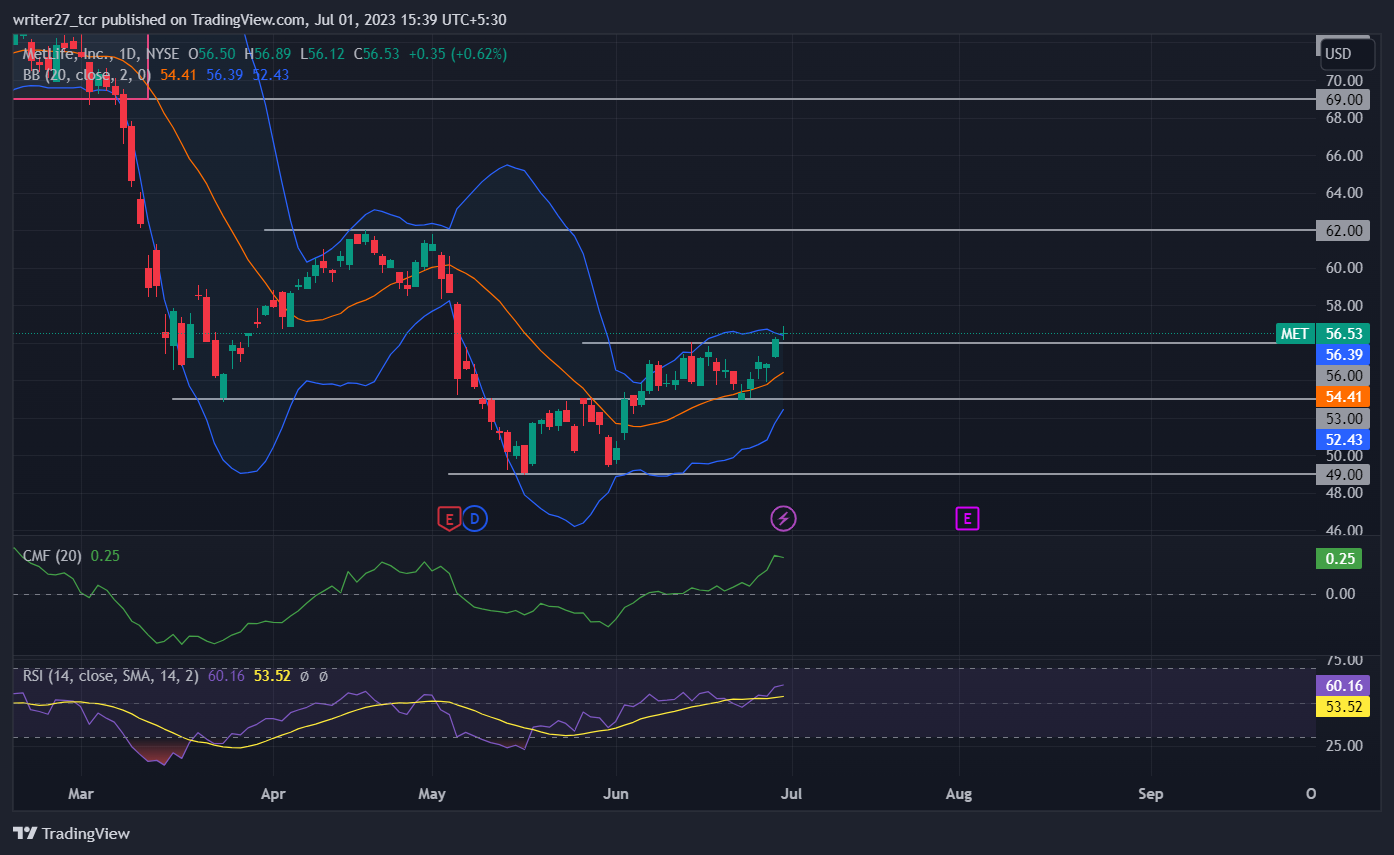
The stock price has crossed the 20 and 50-day EMAs indicating a rise in bullish pressure in the price. Chaikin money flow score is 0.25 suggesting strong strength in the market.
The price has reached the upper band of bollinger indicating the possibility of a pullback. The previous candle has also closed as a weak bullish candle which is also a concern. The relative strength index also reached 60.16 indicating bullish momentum in the price. RSI still had room left until it reached the overbought zone.
Conclusion
The market structure and price action of Metlife has shifted from bearish to bullish after the price reached the support level of $49. Met stock price is currently headed toward $62 if bullish momentum prevails. The technical parameters are favoring the buying side as the price is gaining bullish momentum.
Technical Levels
Major support levels: $49 and $53
Major resistance levels: $62 and $69
Disclaimer
The views and opinions stated by the author, or any people named in this article, are for informational purposes only. They do not establish financial, investment, or other advice. Investing in or trading crypto assets comes with a risk of financial loss.

Andrew is a blockchain developer who developed his interest in cryptocurrencies while pursuing his post-graduation major in blockchain development. He is a keen observer of details and shares his passion for writing, along with coding. His backend knowledge about blockchain helps him give a unique perspective to his writing skills, and a reliable craft at explaining the concepts such as blockchain programming, languages and token minting. He also frequently shares technical details and performance indicators of ICOs and IDOs.


