
 Home
Home News
News
- 1 Frax is currently trading at $6.468, while seeing a fall of 24.67% in the 24-hour trading volume.
- 2 The Frax price recorded a rise of 6.09% in the last 7 days.
Frax price prediction suggests the FXS token is gaining substantial support from the bulls. Recently, the price of the FXS token made a breakout above the 50 EMA level; it is steadily approaching the 200 EMA first target point. Observing the historical price action despite the strong presence of sellers, the buyers are not willing to give up at present. The Frax price is presently forming a bullish engulfing candle.
Frax protocol is the first functional algorithmic stablecoin system. Frax is open-source and permissionless. The intent of the Frax protocol is to provide highly scalable, decentralized algorithms in place of fixed supply digital assets. Frax is the first kind of decentralized stablecoin to categorize itself as a fractional algorithmic operating a unique category.

Decrease in LunarCrush Levels Regarding Frax
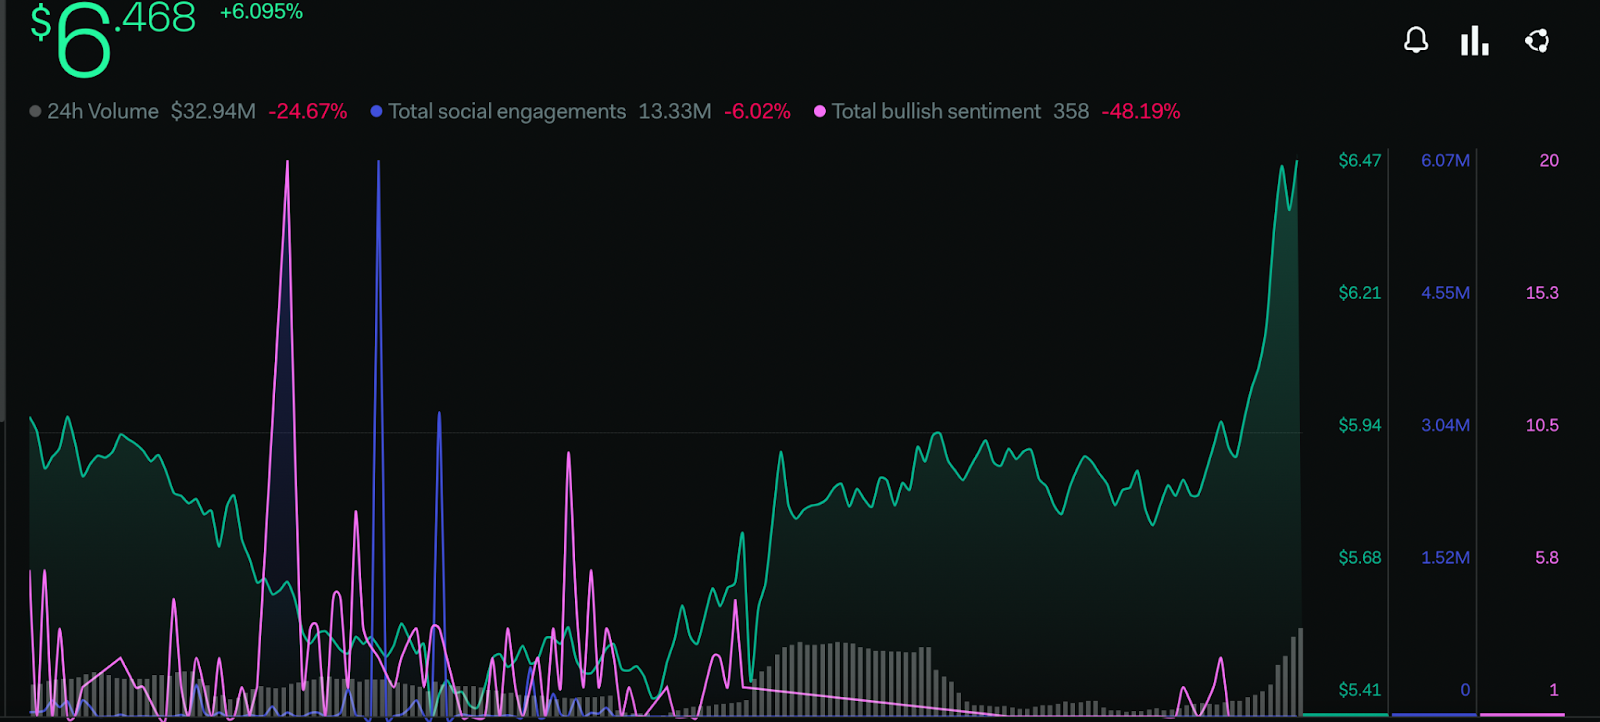
There is a plunge in the parameters of the LunarCrush platform. The total bullish sentiment metric has dropped by 48.19%. A fall of 6.02% is observed in the total social engagement level which suggests the potential investors in the community are reluctant regarding the further increase in token.
Major Hike In Greed Sentiment Of Investors
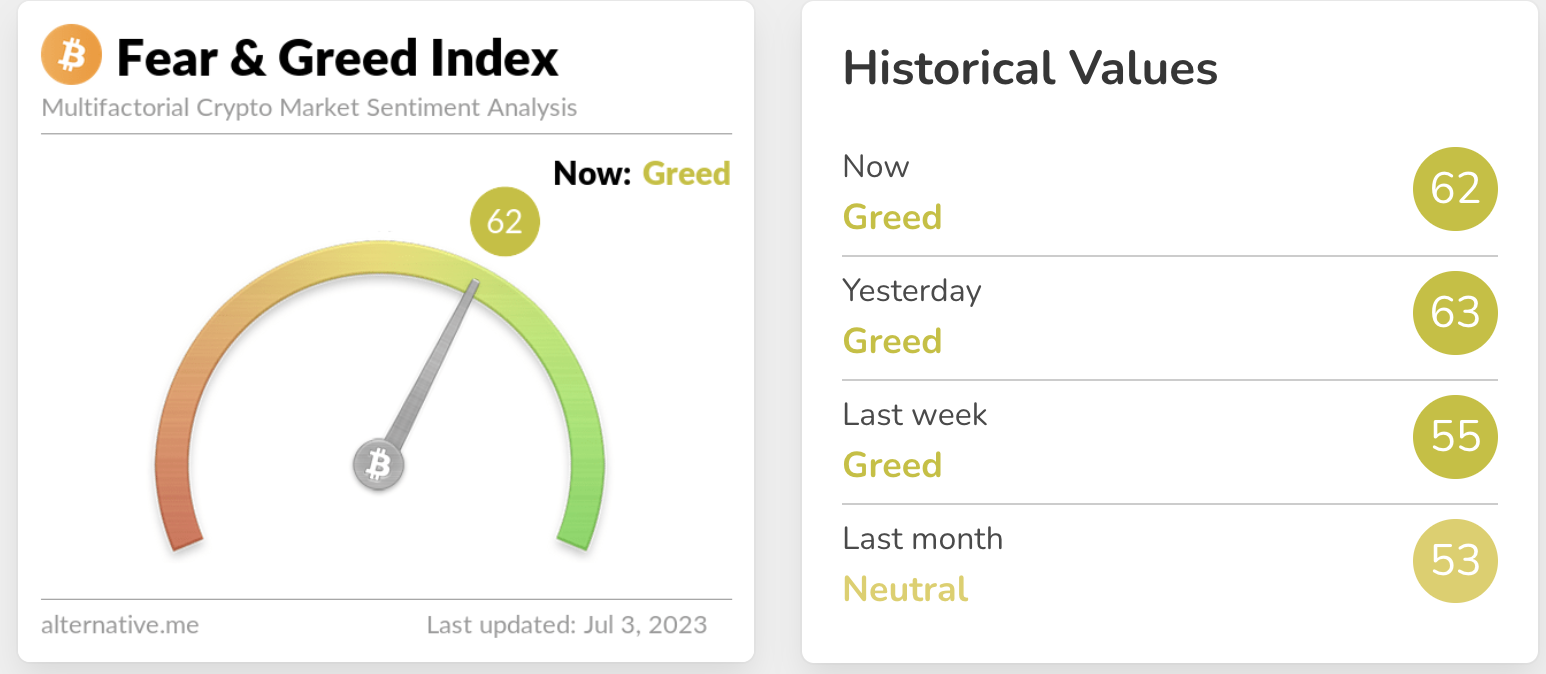
Investor statements concerning the overall cryptocurrency market are moving in the greed zone in the sentiment index. The market’s sentiment metric had increased by 7 points in the last week when the index was moving near 55 points.
The recent value of the sentiment index is 62 points in the Fear and Greed index as per the Alternative(dot)me platform.
Frax Price Prediction: Technical Analysis On 1-Day Chart
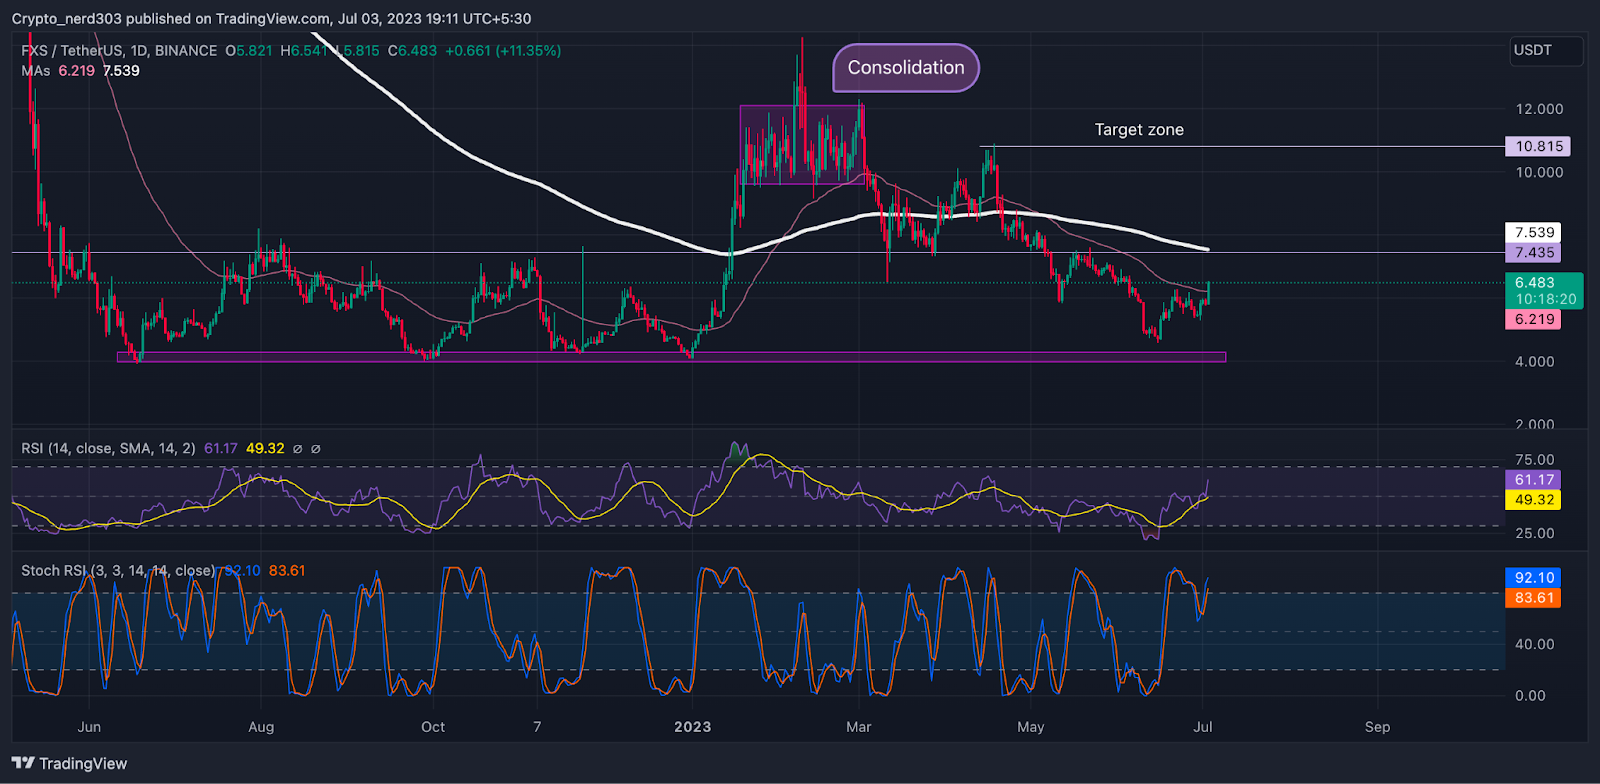
The RSI line has recently crossed above the median line. The present value of the RSI is 61.17 points and the value of 14 SMA is 49.32 points. The RSI line is approaching the overbought level.
At present, the stochastic RSI has approached the overbought level and the value of the stochastic RSI is 92.19 points. The stochastic RSI is giving a bearish crossover between the %K and %D line.
Conclusion
According to the analysis, the Frax price is gaining substantial support from the bulls. There is a plunge in the bullish sentiments of the investors according to LunarCrush whereas the price of FRX is approaching its immediate resistance level. The Oscillators are moving near their resistance levels on the 1-day chart.
Technical Levels:
Support –$4.000
Resistance – $8.000
Disclaimer:
The views and opinions stated by the author, or any people named in this article, are for informational purposes only, and they do not establish financial, investment, or other advice. Investing in or trading crypto assets comes with a risk of financial loss.

Andrew is a blockchain developer who developed his interest in cryptocurrencies while pursuing his post-graduation major in blockchain development. He is a keen observer of details and shares his passion for writing, along with coding. His backend knowledge about blockchain helps him give a unique perspective to his writing skills, and a reliable craft at explaining the concepts such as blockchain programming, languages and token minting. He also frequently shares technical details and performance indicators of ICOs and IDOs.


