
 Home
Home News
News

- 1 Ravencoin is currently trading at $0.02012 while seeing a substantial surge of 118.25% in the 24-hour trading volume.
- 2 The Ravencoin price recorded a fall of 1.98% in the last 7 days.
Ravencoin price prediction suggests that the RVN token is presently facing severe rejection from the 200-day EMA. Despite making multiple attempts to break the resistance level, it has not been able to breach above it as of now. When observing the historical price action, it is evident that the buyers are not ready to yield at present. Ravencoin price has been receiving constant support from buyers near $0.01800 for the past few weeks.
Ravencoin is a digital peer-to-peer network aiming to implement a use-case-specific blockchain. It is designed to handle the transfer of assets from one party to another. Ravencoin is built on a fork of a Bitcoin code and it was launched on January 3, 2018.

Decrease In LunarCrush Levels Regarding Ravencoin
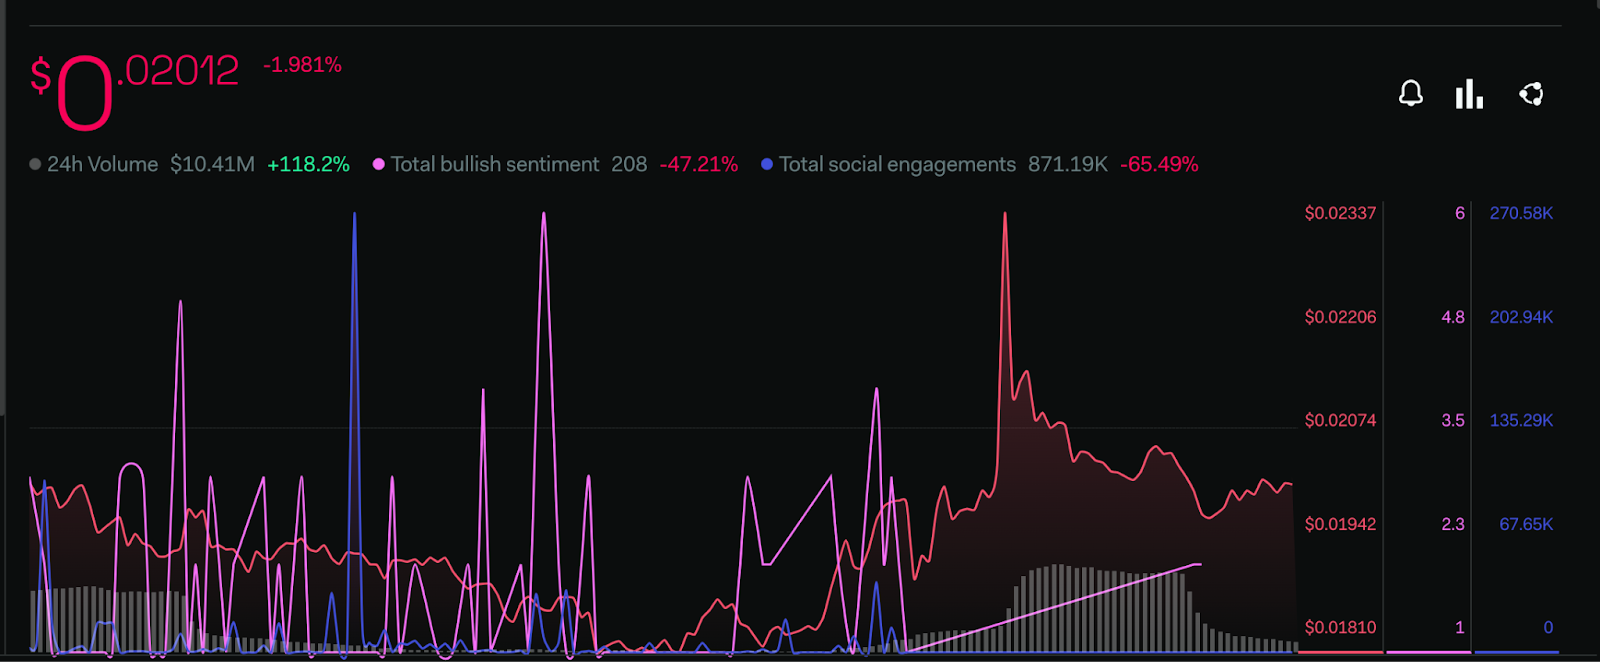
There is an abrupt plunge in the majority of parameters shown on the LunarCrush platform. The total bullish sentiment metric has decreased by 47.21%. A fall of 65.49% is observed in the total social engagement level which suggests that the potential investors in the community are hesitant.
Major Hike In Greed Sentiment Of Investors
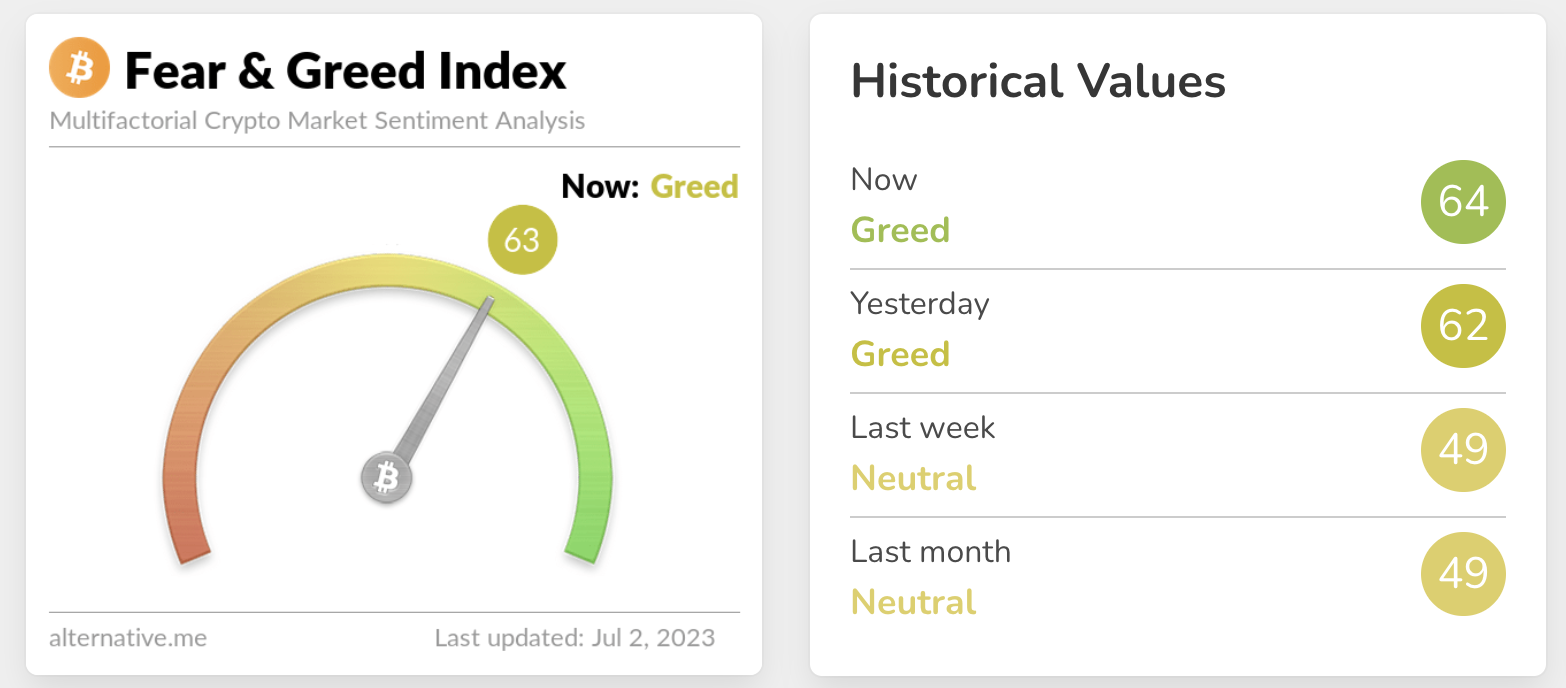
Investor sentiments concerning the overall cryptocurrency market are rising significantly. The market’s sentiment metric had jumped by 16 points within the last week when the index was moving near 49 points.
The current value of the sentiment index is 64 points in the greed zone as per the Alternative(dot)me platform.
Ravencoin Price Prediction: Technical Analysis On 1-Day Chart
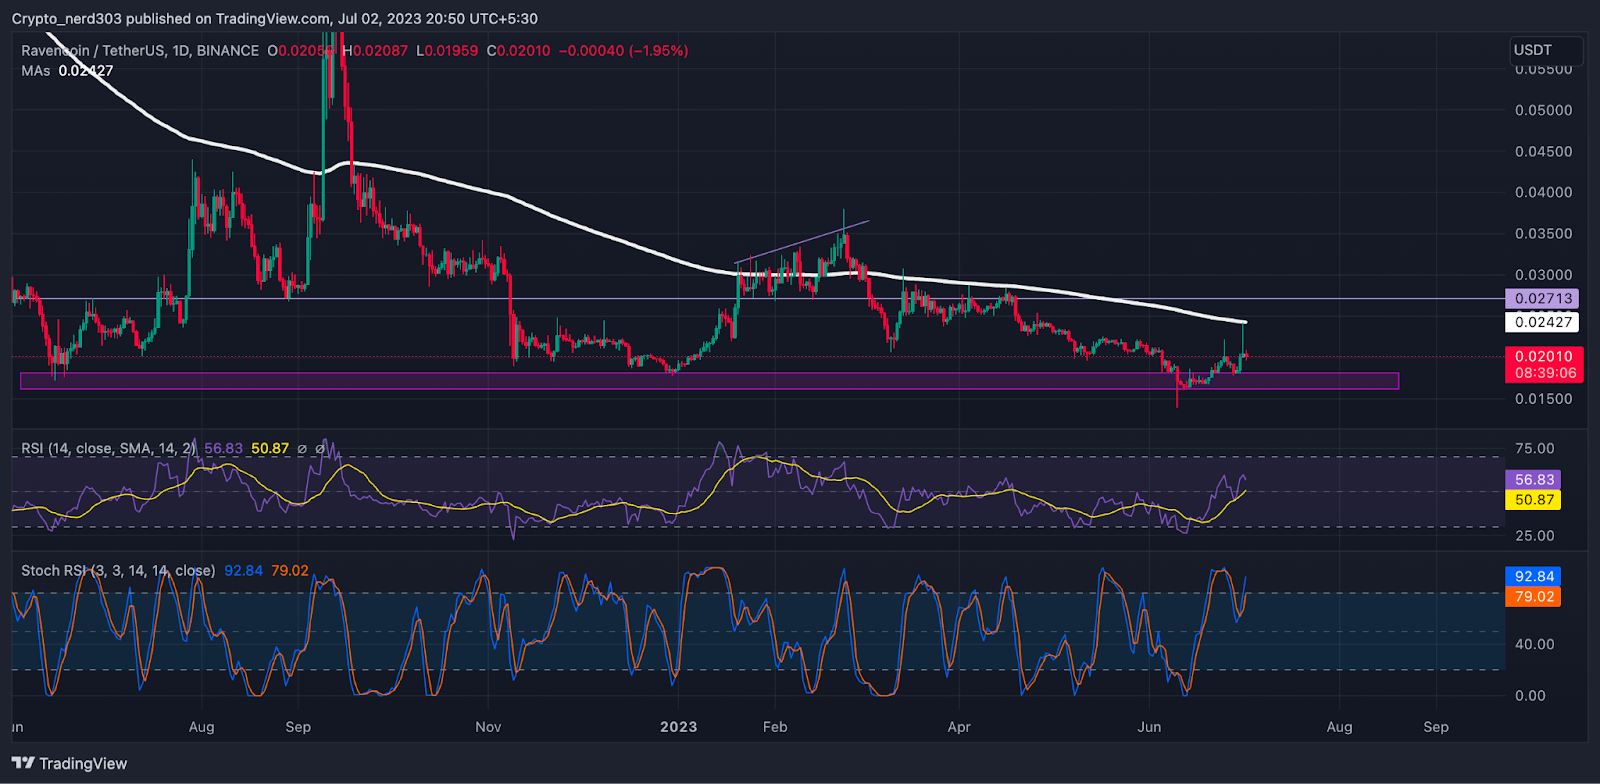
The relative strength index (RSI) line is moving above the median line on the daily timeframe. The present value of the RSI is 56.83 points and the value of the 14-day SMA is 50.87 points. The RSI line is making a double-top pattern.
At present, the stochastic RSI has reached the overbought level and the value of the stochastic RSI is 92.84 points. The stochastic RSI is making another positive crossover between the %K and %D line after gaining support near the median line on the 1-day chart.
Conclusion
According to the analysis, the RSI and stochastic oscillators are moving near resistance levels. The buyers are attempting to take back control of the Ravencoin chart but the probability of their success is low, according to the price action. When the historical price action, it is clear that the buyers are not ready to yield their control over price action and the RVN token requires substantial effort on their part to recover.
Technical Levels:
Support –$0.01500
Resistance – $0.03000
Disclaimer:
The views and opinions stated by the author, or any people named in this article, are for informational purposes only, and they do not establish financial, investment, or other advice. Investing in or trading crypto assets comes with a risk of financial loss.

Andrew is a blockchain developer who developed his interest in cryptocurrencies while pursuing his post-graduation major in blockchain development. He is a keen observer of details and shares his passion for writing, along with coding. His backend knowledge about blockchain helps him give a unique perspective to his writing skills, and a reliable craft at explaining the concepts such as blockchain programming, languages and token minting. He also frequently shares technical details and performance indicators of ICOs and IDOs.


