
 Home
Home News
News
- 1 Wells Fargo & Co. has passed the Federal Reserve stress test.
- 2 Currently, the company’s stock is trading at $42.68 with a minor rise of 0.54% in the past 24 hours.
- 3 WFC’s 52-week price range is between $35.25 – $48.84.
Wells Fargo & Co. declared the bank will increase dividends after passing the Federal Reserve test. Its stock breaks the 50-Day MA and 200-Day MA in an upward direction. Firstly, it takes support on the 50-Day MA and then broke the 200-day MA with two powerful candles and gives positive momentum right now.
It is estimated the Wells Fargo stock dividend will increase from $0.30 to $0.35 per share if the bank’s board of directors approves it. Wells Fargo stock is undervalued because the intrinsic value of the stock is more than its current market price as per the alpha spread. The financial health of the stock has decreased over the last 5 years, as per the trading view.
Wells Fargo & Co. (WFC) Stock Price Technical Analysis
On the daily time frame, the price of Wells Fargo & Co. stock is above the 50-day and 200-day MA after consolidating between the 50 and 200-day MA.
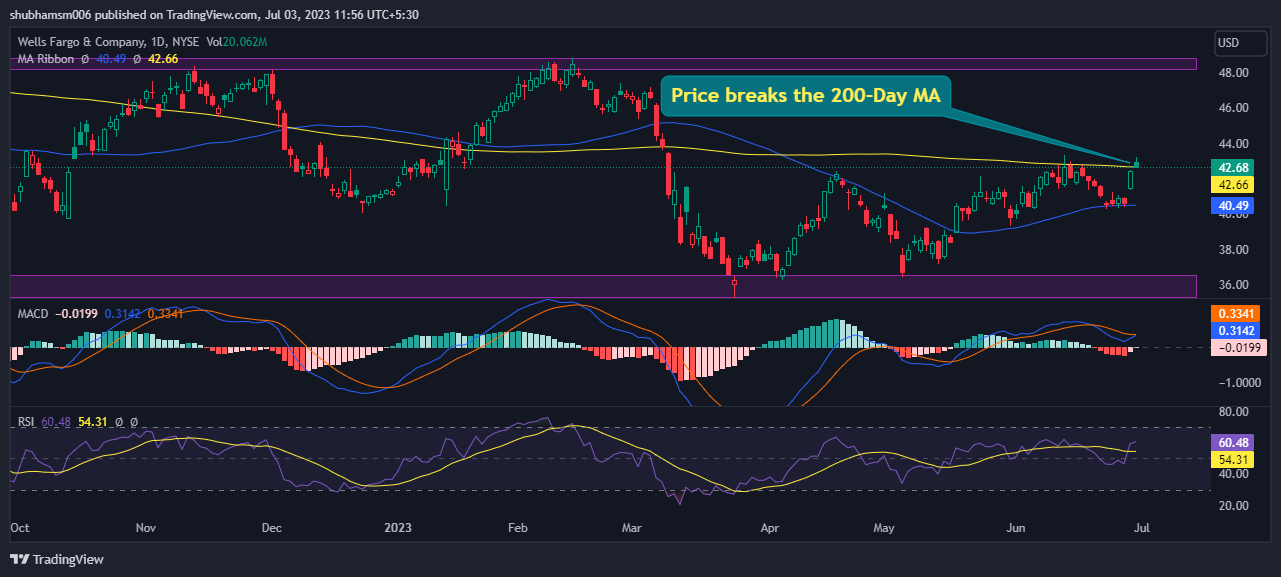
The technical indicator MACD is giving favorable signs. The MACD line at 0.3142 and signal line at 0.3341 is above the zero line, suggesting the MACD is in the positive region.
The current value of RSI is 60.48 points. The 14 SMA line is presently above the median line, around 54.31 points. The 14-Day SMA line is beyond the median line, but it is heading in an upward direction. The bullish sentiment spread around the market. The price is currently heading toward the overbought region.
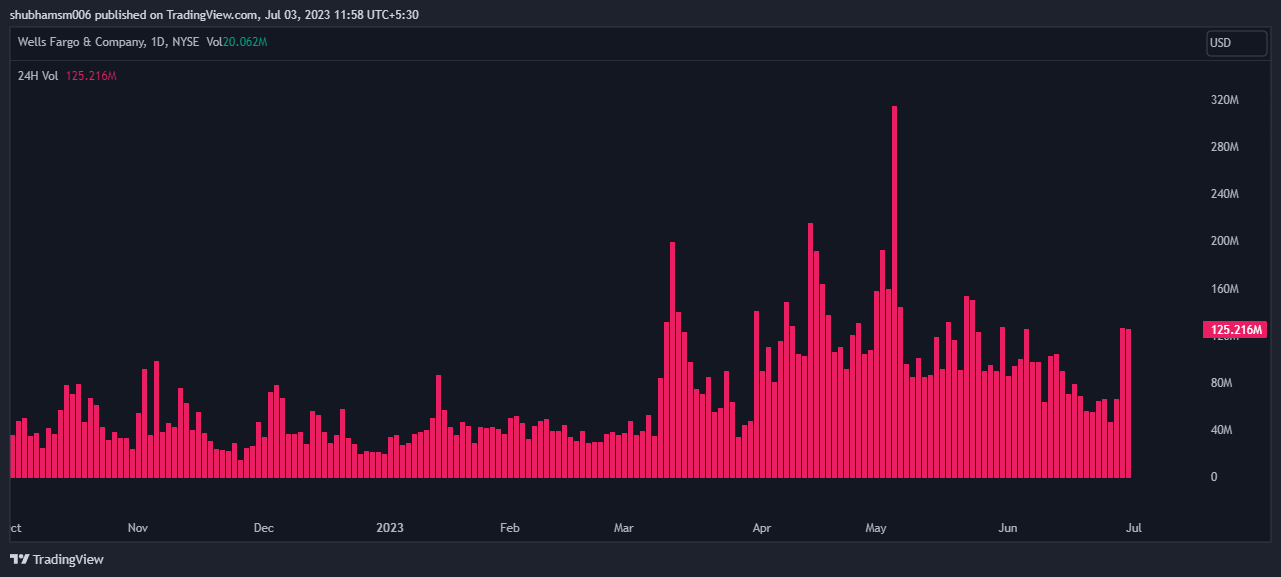
Volume Analysis
The average 3-month volume of the stock is 21.82 Million and the average volume of the last 10 days is 17.86 Million. A sudden jump in volume is observed because of the positive news about the stock.
Conclusion
The price of the stock is currently trading in a narrow range channel in an upward direction. Wells Fargo & Co. stock is showing decent performance in the market. The technical chart is also looking great and gives a profitable viewpoint. The price action indicates the price might grow more in the coming days if it breaks its primary trendline resistance slightly. Major reliable indicators like EMA, RSI, and MACD give positive signals about the stock. If the bulls continue to support the stock, then it will easily break the level of $48.
Technical Levels:
- Support – The current support level for the stock is $36.77.
- Resistance –The current resistance level for the stock is $48.
Disclaimer
The research given in this article is for informative and educational use only. Do not take this information as a financial or trading recommendation. Trading and investing have financial risks. Before creating any investment or trading decision, please consider your risk profile and circumstances.

With a background in journalism, Ritika Sharma has worked with many reputed media firms focusing on general news such as politics and crime. She joined The Coin Republic as a reporter for crypto, and found a great passion for cryptocurrency, Web3, NFTs and other digital assets. She spends a lot of time researching and delving deeper into these concepts around the clock, and is a strong advocate for women in STEM.


