
 Home
Home News
News
- 1 Zcash price prediction suggests that ZEC crypto may see a decline
- 2 Zcash price is up by 10.90% in the last 7 days on the daily chart.
Zcash price prediction suggests that ZEC crypto is presently moving near a crucial resistance zone. The short sellers may find this opportunity beneficial as the price is giving a 4:1 risk-reward ratio. Buyers may prefer to wait on the sidelines regarding the current scenario unless the price gives a positive breakout above the 200 EMA on the daily timeframe.
Zcash price is presently moving on a downtrend; taking constant resistance from the 100 EMA. The Zcash crypto price is trading under all the major EMA levels under the 200 EMA resistance zone. The price action suggests that the Zcash token can see a further decline in its value as the market structure is currently in the initial stage of a bearish correction.

Zcash price is currently trading at $33.83 with a 27.15% gain in the 24-hour trading volume and has a market cap of $552.43 Million.
Investors Showing A Surge In Bullish Optimism
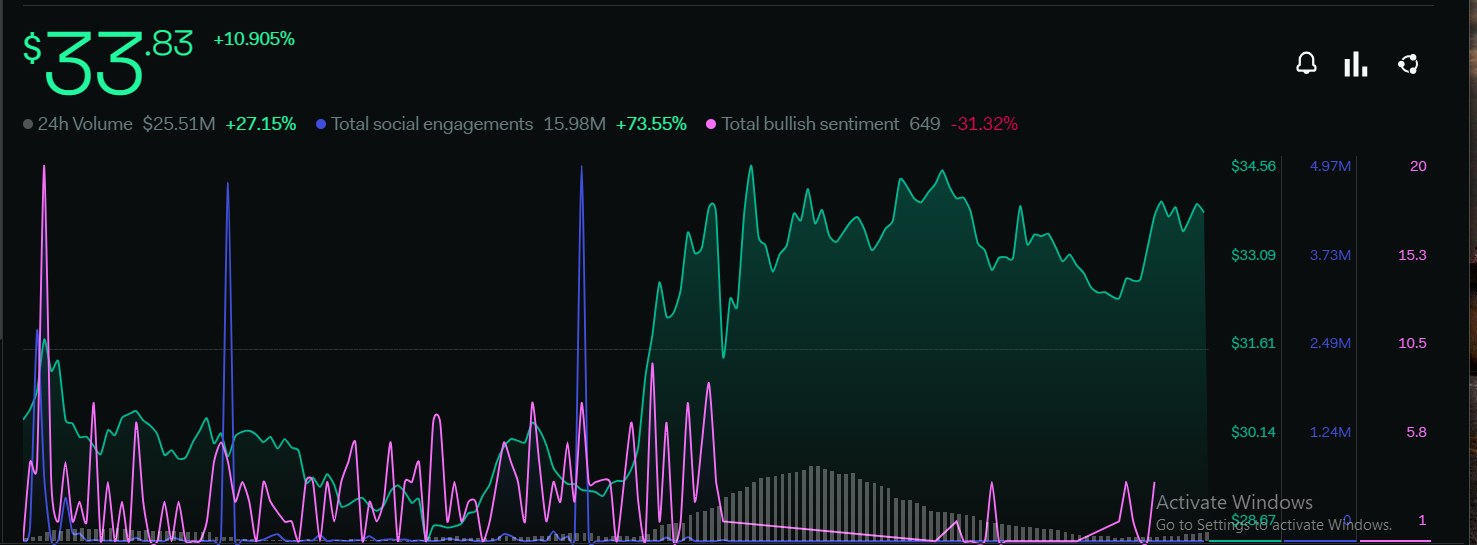
According to LunarCrush, the investors are reluctant regarding the further appreciation of the token. The total bullish sentiment parameter has dropped by 31.32% although the total social engagement metrics are seeing a positive turn. It surged by 73.55% within the past week indicating that the community is getting more engaged regarding the token across various social media platforms.
The 24-hour trading volume is up by 27.15% indicating that buyers and sellers are more active regarding Zcash within the last few weeks.
Zcash Price Prediction: Technical Analysis of Zcash Price On Daily Chart
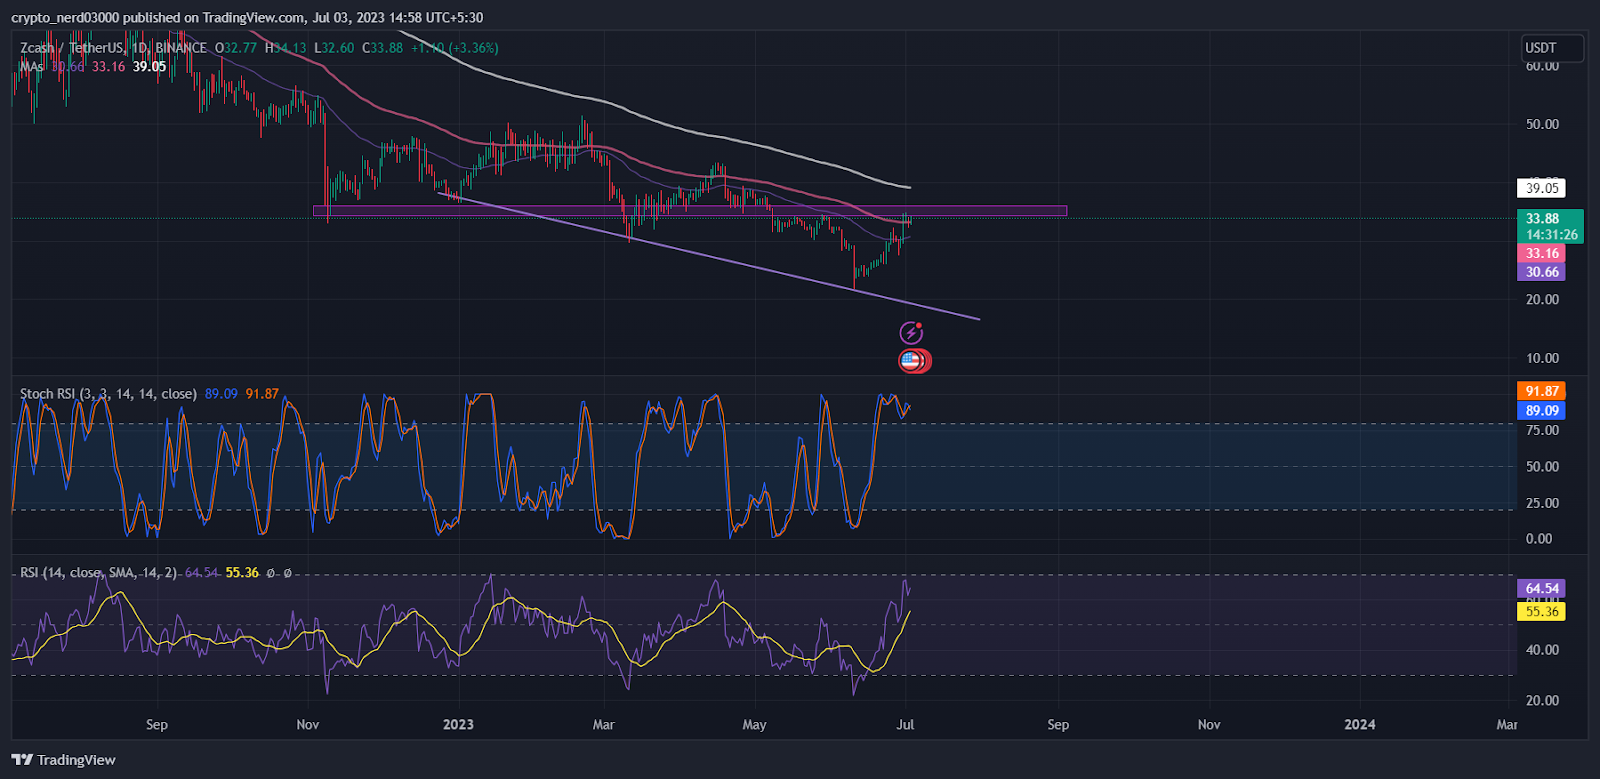
The RSI line is making a higher high and low pattern on the 1-day chart. The RSI line is moving near 64.54 points and the 14 SMA is providing resistance at around 55.36 points. The RSI line indicates that the price of the Zcash token may soon see a bearish decline.
Stochastic RSI is consolidating near the overbought level. The %D and %K lines make a negative crossover between them though it is yet to intercept the 80 RSI zone. The present value of stochastic RSI is 89.09 points.
Conclusion
The price of Zcash is presently taking divergence from the major EMA levels. Observing historical chart patterns it can be estimated that the price has been respecting its 100 EMA. The oscillators are currently indicating that the price is overbought. The investors are not very optimistic regarding the recovery of the token. The short sellers may find this opportunity beneficial whereas buyers may prefer to wait on the sidelines regarding the current scenario.
Technical levels
Support – $1.500 and $1.000
Resistance – $2.500 and $3.000
Disclaimer
The views and opinions stated by the author, or any people named in this article, are for informational purposes only, and they do not establish financial, investment, or other advice. Investing in or trading crypto assets comes with a risk of financial loss.

Andrew is a blockchain developer who developed his interest in cryptocurrencies while pursuing his post-graduation major in blockchain development. He is a keen observer of details and shares his passion for writing, along with coding. His backend knowledge about blockchain helps him give a unique perspective to his writing skills, and a reliable craft at explaining the concepts such as blockchain programming, languages and token minting. He also frequently shares technical details and performance indicators of ICOs and IDOs.


