
 Home
Home News
News
- 1 The price of Cosmos is currently trading near $9.828 with an increase of 3.01% in the 24-hour trading volume.
- 2 Cosmos price is up by 5.27% over the last 7 days.
Cosmos price prediction suggests that ATOM price could decline if it fails to break its present resistance zone. Cosmos price recently saw a decline after breaking its support zone near $10.500. ATOM token is presently making a rally to retest its immediate barrier.
The candlestick pattern shows that ATOM price is seeing a surge in buying activity. Although, presently it is moving near a crucial supply zone which may attract more sellers to step into the price action. 4 parameters are supporting the bears. Support and resistance, the oscillators, EMAs, and market structure. The breaking of the immediate obstacle can set the tone for future trend for the price.
The present value of ATOM is $9.828, It has a market capitalization of around $3.4 Billion seeing a surge within the past few weeks.
Cosmos Price Prediction: Technical Analysis on 1-Day Chart
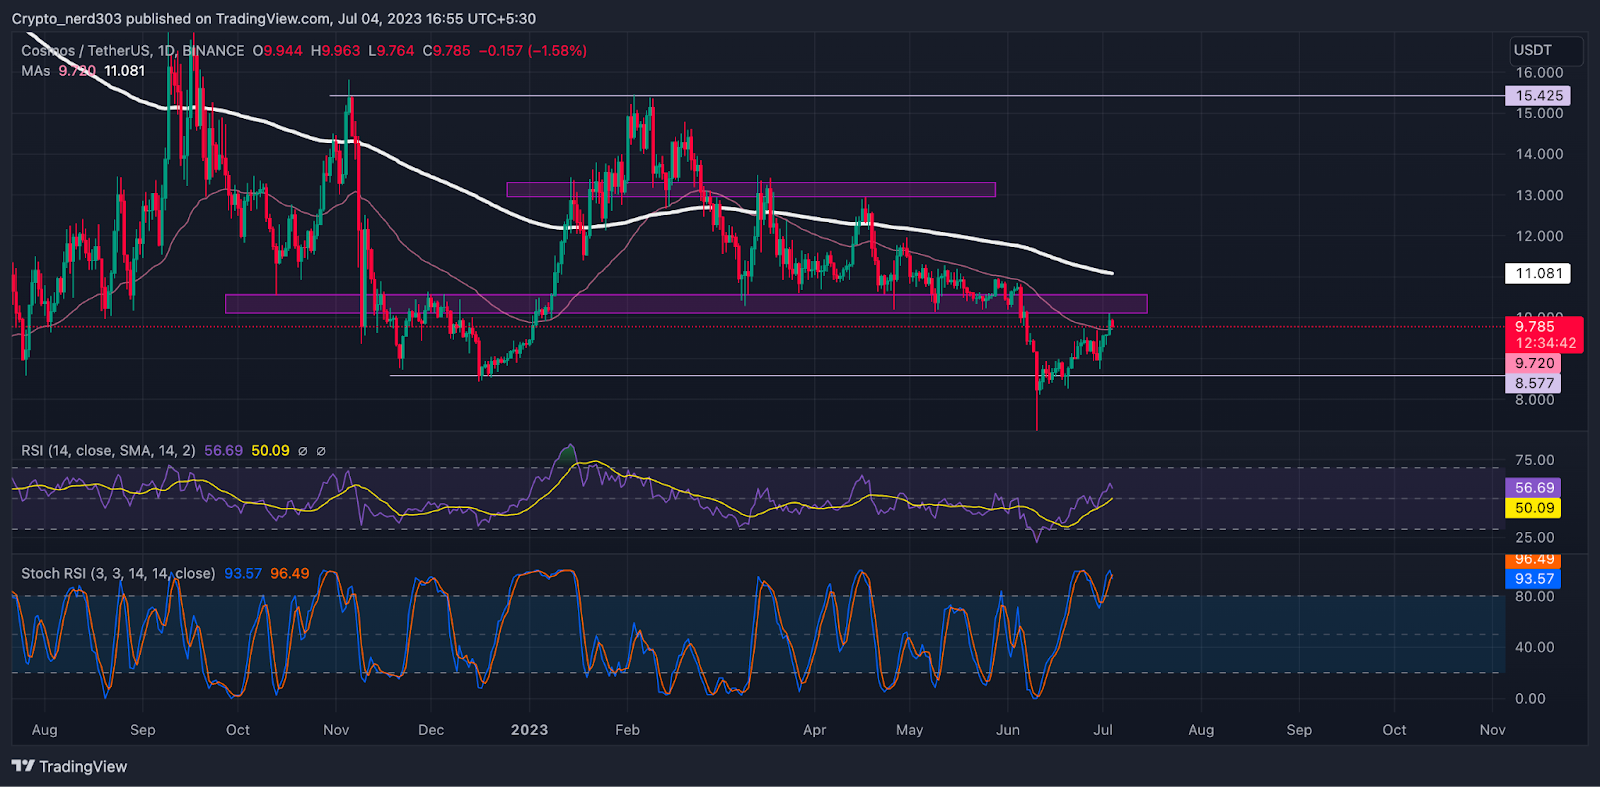
ATOM token is presently moving below major the 50,100,200 EMA levels. If the price fails to get the buyers’ support from the recent support level, it may see a decline of 12% within the next few days. The price action indicates that the odds are in the bears’ favor on a daily chart.
The RSI line is presently moving above the median line; taking constant support from 14 SMA. The current RSI value of the Cosmos token is 56.69 points whereas the 14 SMA is providing support to it at around 50.09 points.
Technical Analysis On Daily Chart Of Cosmos/BTC
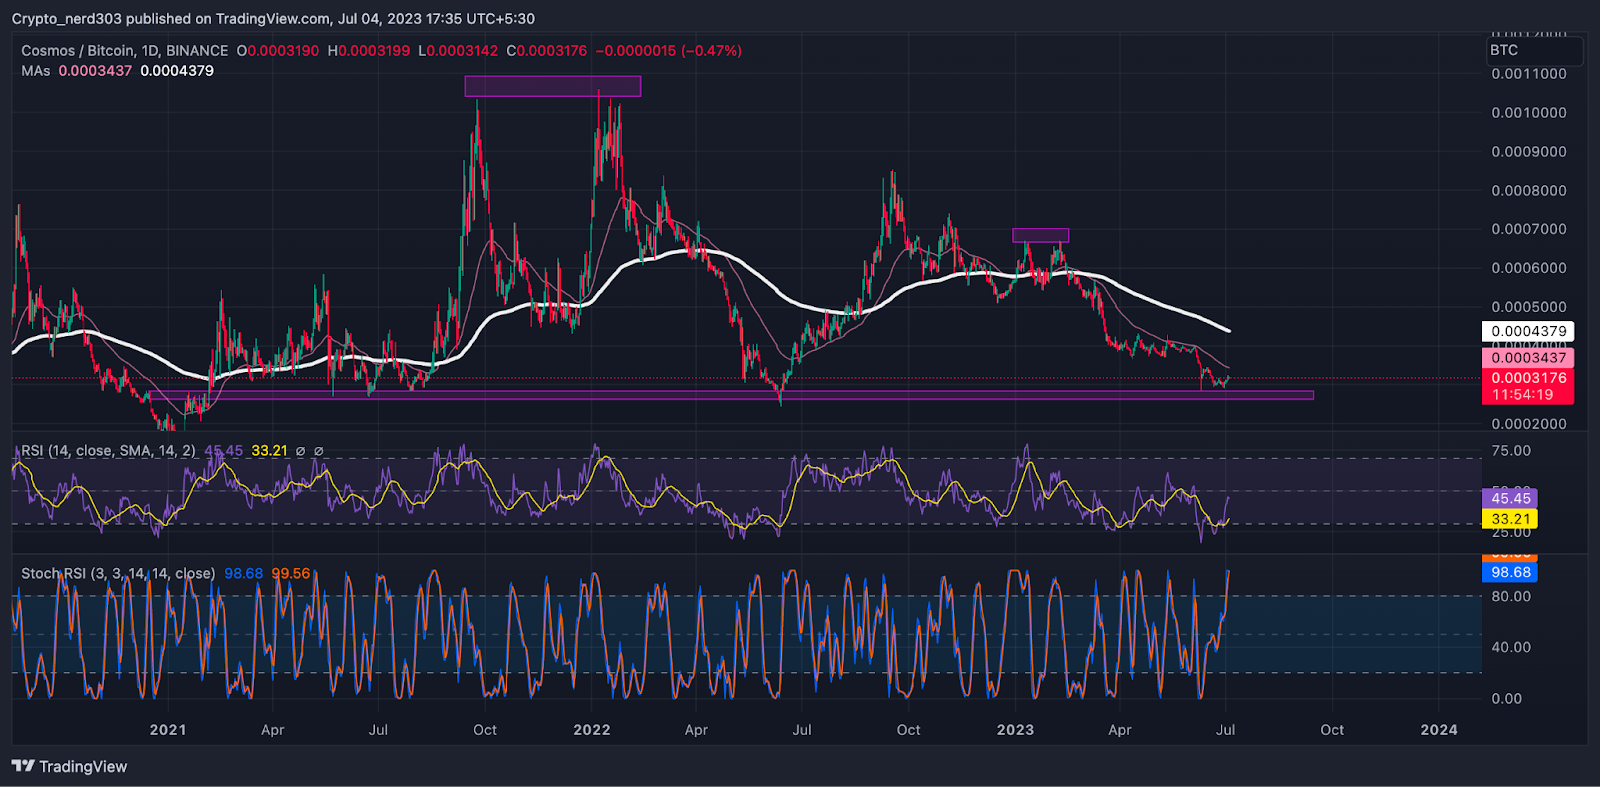
The Cosmos/BTC pair is presently moving near its immediate support level. Cosmos/BTC token has more probability of making a bullish rebound though the 20,50,100,200 EMAs may act as major resistance levels.
Investors may prefer to wait for a favorable reversal candlestick pattern such as a hammer or engulfing candle with the confluence of oscillators before making a definite decision.
The RSI line is moving near its previous resistance level near the median line around 45.45 points whereas the 14 SMA is providing support to it around 33.21 points. The stochastic RSI is moving near the overbought zone.
Conclusion
According to the analysis, Cosmos price prediction suggests that investors are optimistic regarding the current trend, Although, the bears’ may sway the investors on the daily time frame which may cause the buyers to surrender the trend.
Technical Levels:
Support – $8.000
Resistance – $10.000
Disclaimer
The views and opinions stated by the author, or any people named in this article, are for informational purposes only, and they do not establish financial, investment, or other advice. Investing in or trading crypto assets comes with a risk of financial loss.

Andrew is a blockchain developer who developed his interest in cryptocurrencies while pursuing his post-graduation major in blockchain development. He is a keen observer of details and shares his passion for writing, along with coding. His backend knowledge about blockchain helps him give a unique perspective to his writing skills, and a reliable craft at explaining the concepts such as blockchain programming, languages and token minting. He also frequently shares technical details and performance indicators of ICOs and IDOs.


