
 Home
Home News
News

- 1 IOTA token shows selling pressure and faces rejection multiple times.
- 2 Bulls are not able to surpass the 20-day EMA mark.
The IOTA token continues to exhibit weakness on the charts, with sellers exerting significant pressure in recent trading sessions. Furthermore, the chart structure favors the bears, and the price continues to form doji candles, which shows a fight between bears and bulls.
The IOTA token price recently witnessed rejection from the supply zone and retested the support range of $0.1400. The bulls showed a rebound from there and stayed in the neutral range. However, the price is stuck in the congestion range, and bulls are attempting to escape this range.

IOTA price is trading above the 20-day exponential moving average (EMA) but cannot surpass the 100-day EMA, which currently stands as a barrier. Despite the prevailing weakness, the trajectory of the IOTA token indicates that its downside is limited, with a strong demand zone established around $0.1350. This level has proven to be a significant support area for the token.
At the time of writing, the IOTA token trades at $0.1838 with an intraday drop of 1.07%, indicating bearishness. Buyers are making efforts to gain traction in the market, but they are only able to secure a few critical levels of support. Intraday trading volume also increased by 1.50% to 4.89 million. Moreover, the token suggests further volatility in the following sessions.
Daily Charts of IOTA token
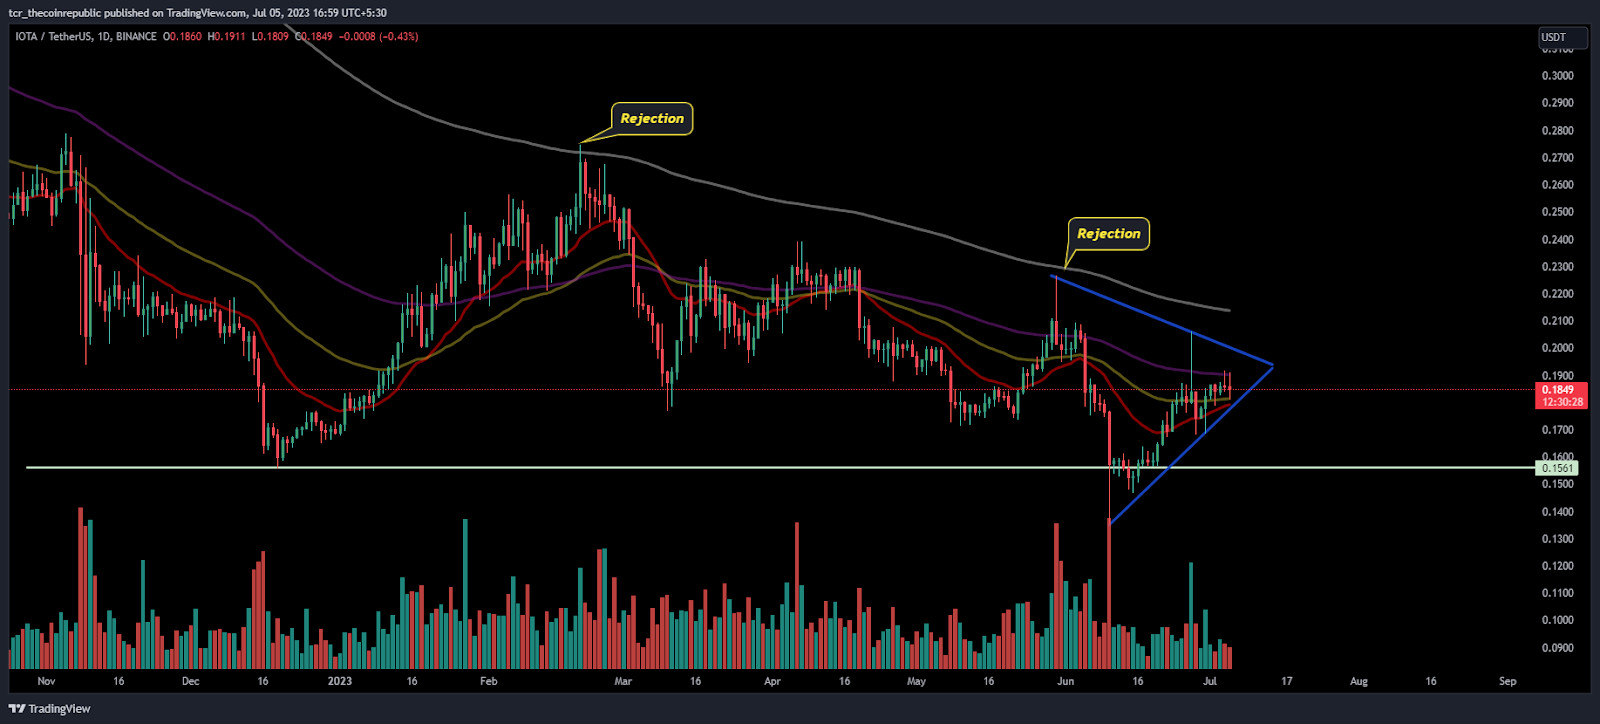
The IOTA token is trading in a downtrend on the daily charts and has underperformed in the past months. Furthermore, the technical indicators continue to signal bearishness, with no signs of a bullish reversal or bounce occurring below the $0.2000 range.
The price of the IOTA Coin has remained trapped within a congestion zone, with sellers consistently taking short positions and effectively maintaining the price near the $0.2000 level.
Furthermore, the chart showcased a symmetrical triangle pattern which has a neckline of $0.1900 on the top and $0.1600 on the downside.
What Technical Indicators Say
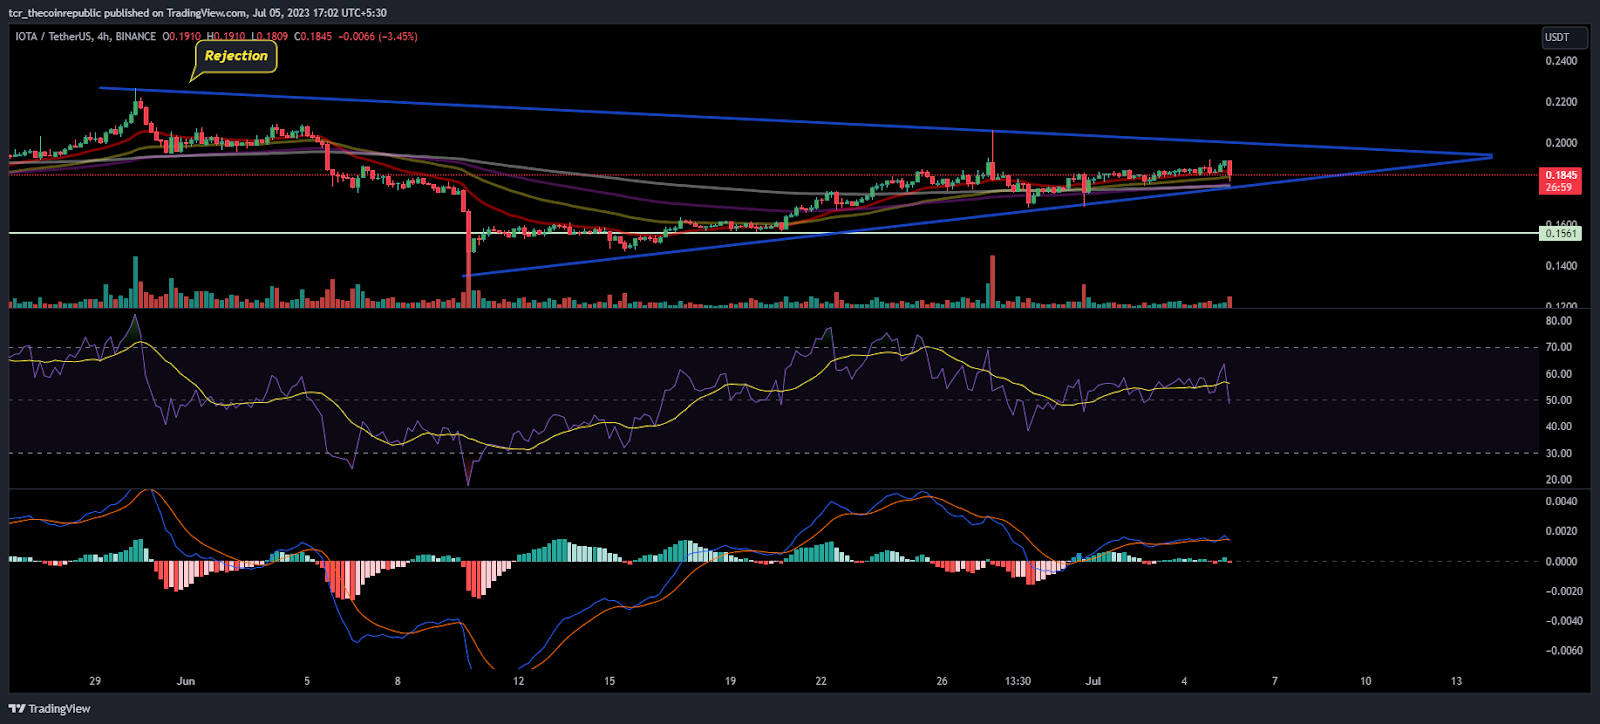
On the 4-hour charts, the IOTA token is currently under the control of the sellers, and buyers are not able to surpass the range of neutrality. The price action indicates that sellers are persistently pushing back against the bulls below the $0.2000 trajectory, causing the gains from the top to erode.
The relative strength index (RSI) curve is near the neutral range of 50, indicating negative divergence and bearishness on the charts.
The MACD indicator also suggests a neutral signal, and both the moving averages converge, which suggests that a significant move can be shown in the upcoming sessions.
Conclusion:
The IOTA token price remains firmly within the control of sellers, as buyers struggle to regain momentum and exhibit a lack of strength in their efforts.
Technical levels
Resistance levels: $0.2000 and $0.2750
Support levels: $0.1700 and $0.1560
Disclaimer
The views and opinions stated by the author, or any people named in this article, are for informational purposes only. They do not establish financial, investment, or other advice. Investing in or trading crypto assets comes with a risk of financial loss.

Andrew is a blockchain developer who developed his interest in cryptocurrencies while pursuing his post-graduation major in blockchain development. He is a keen observer of details and shares his passion for writing, along with coding. His backend knowledge about blockchain helps him give a unique perspective to his writing skills, and a reliable craft at explaining the concepts such as blockchain programming, languages and token minting. He also frequently shares technical details and performance indicators of ICOs and IDOs.


