
 Home
Home News
News
- 1 Ripple price prediction suggests that investors may wait on the sidelines for a short while.
- 2 Ripple price is up by 2.15% on the daily chart over the last 7 days.
Ripple price prediction suggests that XRP crypto has been making constant attempts to attain the $0.60 target without success. The price action suggests that bulls are not prepared to yield yet. The XRP price is presently trading above all the major EMA levels on the daily chart after giving a bullish breakout in early March.

Ripple price is presently moving on an uptrend above the 20, 50, 100 and 200 EMA levels. Currently, the price is making a rebound from its immediate support level near the 200 EMA with a bullish doji candle. Although the buyers may prefer for the price to give a close above $0.50

as it is acting as the current resistance for XRP according to the price action. There is a possibility that the price may take a correction from this level.
If the price takes a rejection from $0.50, it could decline by 7 – 14% within the next few weeks. However, if it succeeds in breaking above the present resistance, it has the potential to give a 14 – 16% rally.
Ripple price is currently trading at $0.48 (press time) and has a market cap of $25.4 Billion. The 24-hour trading volume is down by 5.63% indicating that buyers and sellers are getting less active regarding Ripple over the last few weeks.
RipplePrice Prediction: Technical Analysis of RipplePrice On Daily Chart
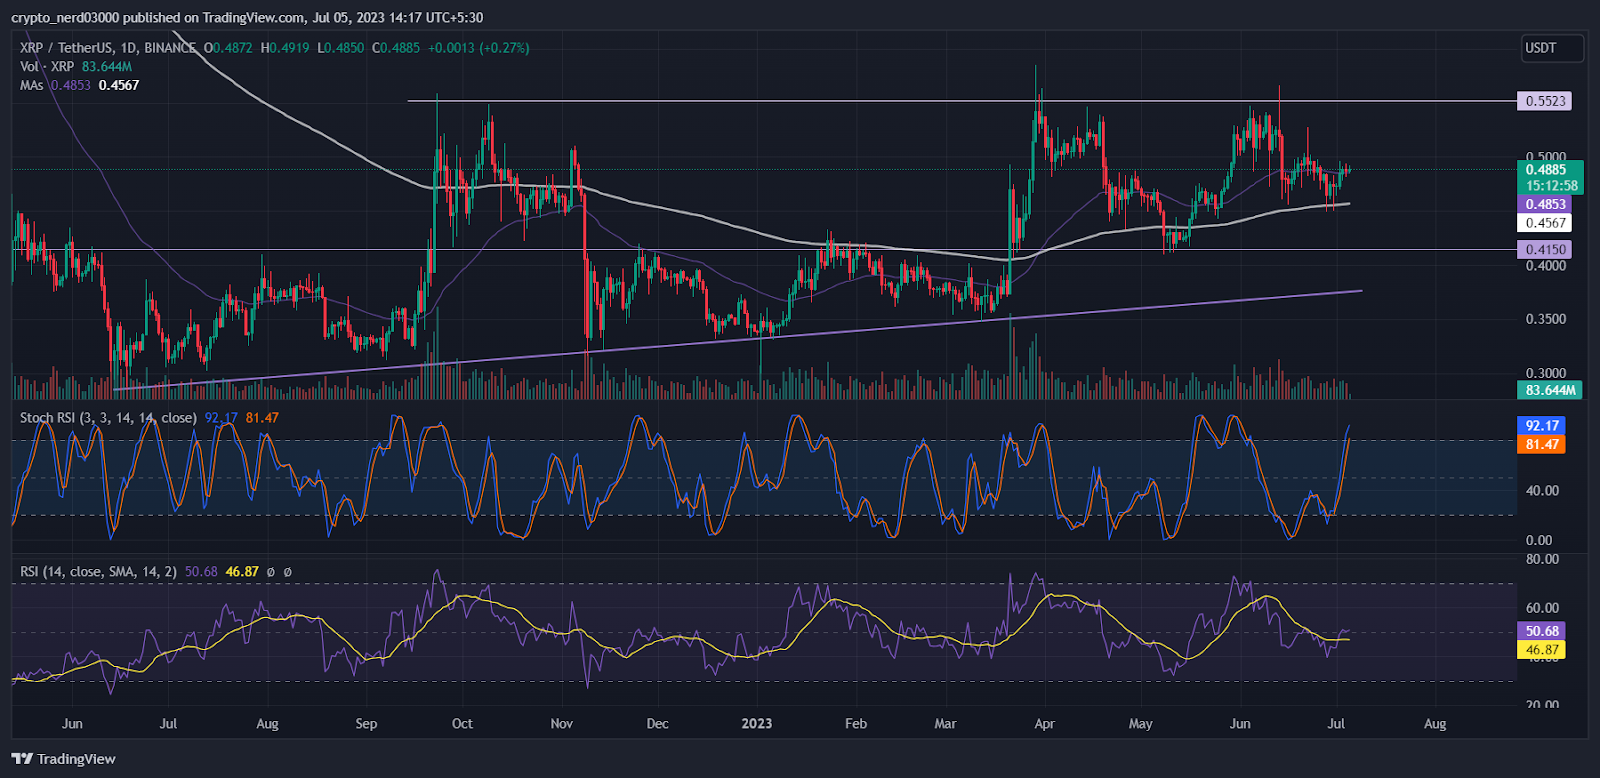
The RSI line is presently taking resistance from the median line on the 1-day chart. The RSI line is moving near 50.68 points and the 14 SMA is providing support at around 50.68 points. The RSI line is moving near its previous resistance level. Buyers may wait for a crossover or reversal before making a decision.
The stochastic RSI approached the overbought level. The %D and %K line may make a negative crossover between them though it is yet to intercept the 80 RSI zone. The present value of stochastic RSI is 92.17 points.
Conclusion
According to the analysis, XRP price is presently trading above all the major EMA levels. Historical chart patterns show that the bulls have not been successful in giving a close above $0.60. The oscillators are near their respective resistance levels. There is a major possibility that the price may take a correction from its immediate resistance level as most seasoned investors generally give importance to recent price action.
Technical levels
Support – $0.400 and $0.450
Resistance – $0.500 and $0.600
Disclaimer
The views and opinions stated by the author, or any people named in this article, are for informational purposes only, and they do not establish financial, investment, or other advice. Investing in or trading crypto assets comes with a risk of financial loss.

Andrew is a blockchain developer who developed his interest in cryptocurrencies while pursuing his post-graduation major in blockchain development. He is a keen observer of details and shares his passion for writing, along with coding. His backend knowledge about blockchain helps him give a unique perspective to his writing skills, and a reliable craft at explaining the concepts such as blockchain programming, languages and token minting. He also frequently shares technical details and performance indicators of ICOs and IDOs.


