
 Home
Home News
News
- 1 Arbitrum price trades at $1.1096 with a minor loss of 0.21% during the intraday trading session.
- 2 ARB price has crossed below the 20 and 50-day EMAs.
- 3 The year-to-date return of Arbitrum is 121.82% while the three-month return is -8.72%.
ARB price created a high at $1.96 and faced strong resistance from the same level, and since then the price has been witnessing a lack of bullish momentum. The cryptocurrency’s price attempted to retest the high after forming support at $1.15 but the move could not be sustained and the price was once again rejected at the $1.82 level.
Recently, the price formed support at $0.936 as June started with a downfall. The support helped price in gaining back the bullish momentum and in retrieving losses. During the beginning of June, the whole cryptomarket was fearful due to the Securities and Exchange Commission’s (SEC) legal actions against some of the major crypto exchanges, which led to the sell-off of many cryptocurrencies.

Currently, Arbitrum’s price is striving to form a support after it faced resistance from the $1.24 level. The previous candle closed as a strong bearish candle. If bears can push the price below $1.05, there is a probability that the price might head down toward the next support level of $0.936.
On the other hand, if the price can form support and gain bullish momentum, it might retest the resistance level of $1.25. A break and close above $1.25 would provide slight confirmation regarding its move toward $1.50.
Analysis Of Arbitrum Ecosystem
The daily active addresses on the Arbitrum ecosystem have dropped by 2.4% in the past three months to 167,756. Daily transactions have also seen a drop of 20.8%. The daily transactions are currently at 758,892. The total value locked is down by 3.4% to $2162 million. The market capitalization is currently down by 2.66% to $1 billion and the 24-hour trading volume is up by 11.08%.
Will ARB Price Cross Above $1.25 This Week?
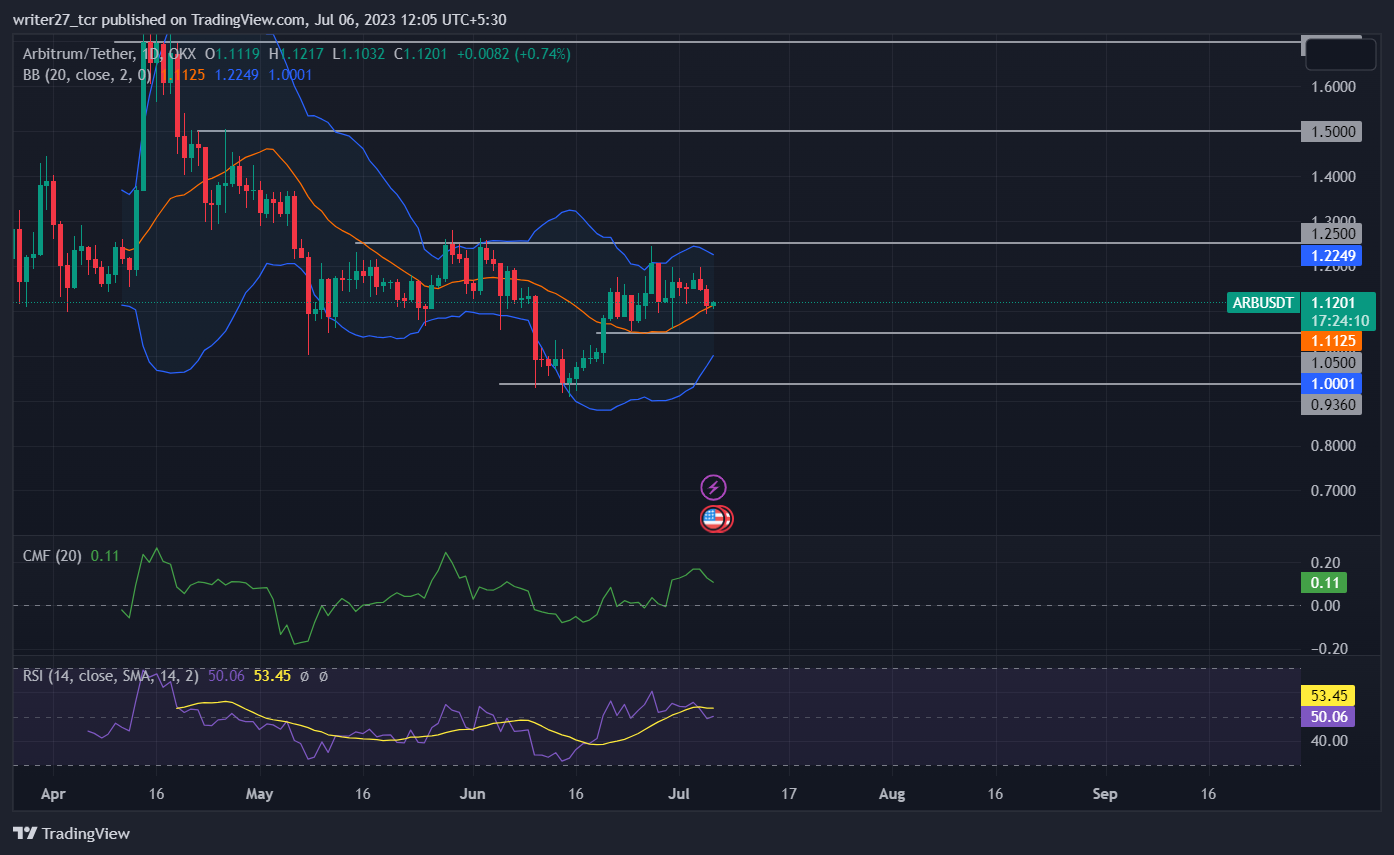
The cryptocurrency’s price trades below the 20,50 and 100-day EMAs indicating bearish momentum in the price. Chaikin money flow score is 0.10, suggesting that there is strength in the market. The relative strength index(RSI) touched the 60 mark and started to dip.
RSI trades at 49.87, denoting that price is in neutral territory and facing equal pressure from bulls and bears. ARB price reached the upper band of bollinger and experienced a short-term pullback. The price is struggling to stay above the 20-day SMA of bollinger.
The long/short ratio is 0.99 with 49.84% longs and 50.16% shorts, indicating a slightly higher pressure from the selling side in the last 24 hours.
Conclusion
The market structure and price action of Arbitrum is currently indecisive as the price is stuck in a messy zone. The technical parameters are providing mixed signals regarding the direction of the price. To make informed trading decisions, it is advisable for traders to wait for the price to either surpass the $1.25 mark or drop below $1.05.
Technical levels
Major support: $0.936 and $1.05
Major resistance: $1.25 and $1,50
Disclaimer
The views and opinions stated by the author, or any people named in this article, are for informational purposes only. They do not establish financial, investment, or other advice. Investing in or trading crypto assets comes with a risk of financial loss.

Andrew is a blockchain developer who developed his interest in cryptocurrencies while pursuing his post-graduation major in blockchain development. He is a keen observer of details and shares his passion for writing, along with coding. His backend knowledge about blockchain helps him give a unique perspective to his writing skills, and a reliable craft at explaining the concepts such as blockchain programming, languages and token minting. He also frequently shares technical details and performance indicators of ICOs and IDOs.


