
 Home
Home News
News
- 1 The graph price currently trades at $0.1199 while witnessing a spike of 0.5% during the intraday session.
- 2 GRT price trades above the 20,50 and 100-day EMAs.
- 3 The year-to-date return of The Graph is 116.35% while the three-month return is -17.79%.
The bullish rally for GRT’s price began at the start of 2023, when the price started to rise from the low of $0.0552. This move led to the creation of $0.23240, causing an upward move of roughly 316%. Since then, the price has entered into a wide range consolidation zone, First, The Graph’s price consolidated between the range of $0.11100 and $0.17300, but as bearish pressure increased during the start of June, the price shattered the support level of $0.11100.
After the break, the price entered into a consolidation zone ranging between $0.0970 and $0.13550. Currently, the cryptocurrency’s price is headed toward the support level of $0.097 after it faced rejection from the $0.13550 level. The previous candle closed as a strong bearish candle and if the current candle can break the low of the previous candle, then there is a chance that the price might head toward the $0.097 level.
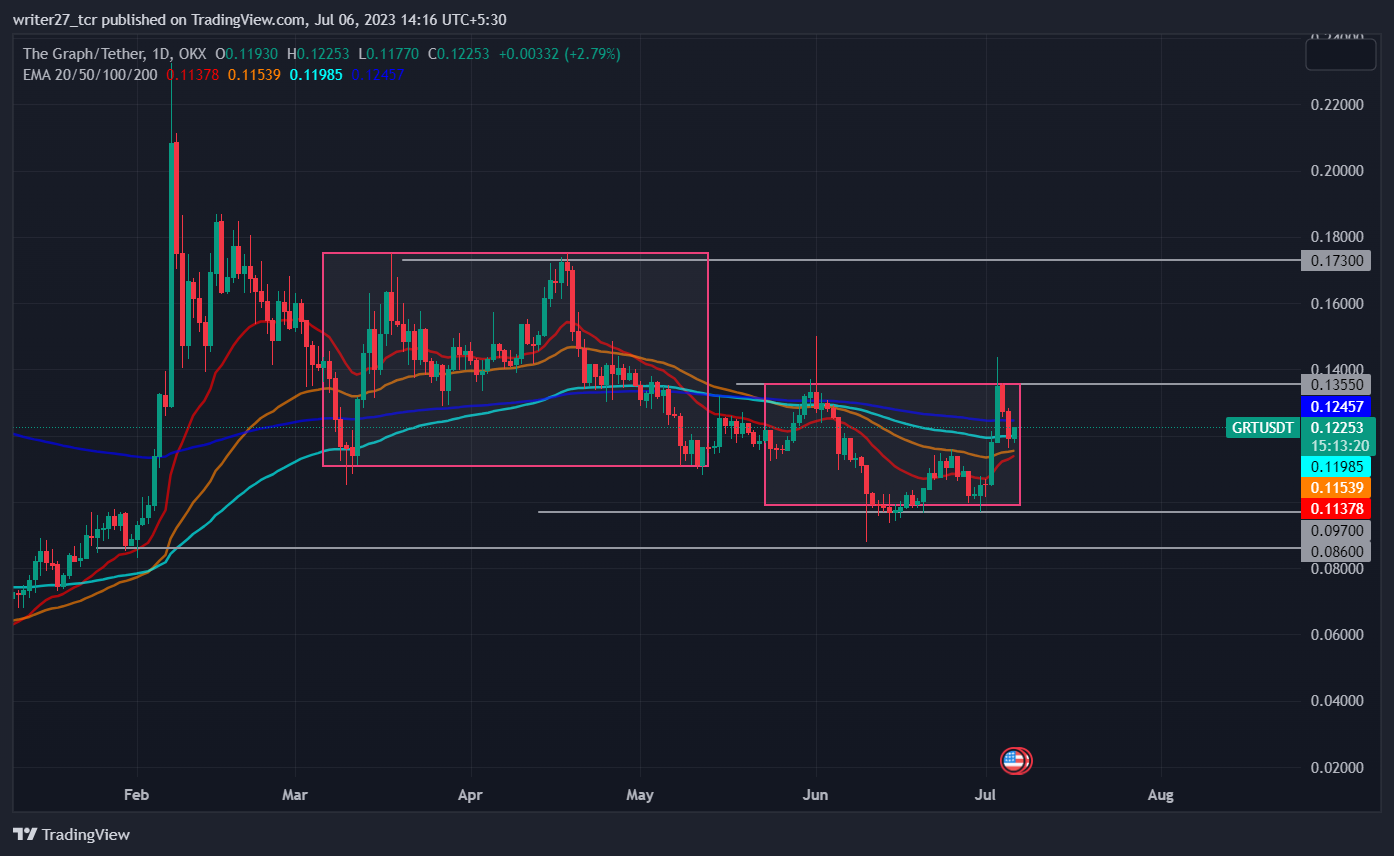
If the price is successful in forming a support, there is a possibility that the price might retest the resistance level of $0.13550. At the start of July, The Graph price registered a noteworthy surge of roughly 36% and formed a high at $0.14837.
The market capitalization of The Graph is down by 4.73% and is currently $1 billion. The 24-hour trading volume has decreased by 14.79%. The price is down by -95.83% from the all-time high of $2.88. If the price can break and close above $0.13550, there is a high probability that the price might head toward $0.17300.
Will GRT Price Retrace Back to the $0.097 Level?

GRT price trades above the 20,50 and 100-day EMAs, indicating bullish momentum in the price. Chaikin money flow score is 0.09, suggesting that there is strength in the market. The relative strength index (RSI) is 56.32, indicating that price possesses bullish momentum.
The price crossed above the upper band of Bollinger and witnessed a retracement. There is a possibility that the price might retrace toward the 20-day SMA of bollinger. The long/short ratio is 0.97 with 49.41% long and 50.59% shorts, suggesting a slightly higher pressure from bears in the last 24 hours.
Conclusion
The market structure and price action of The Graph was bullish but it has now turned bearish after the price faced resistance from $0.13550. The technical parameters suggest that there is still bullish momentum in the price.
If the price can form a support, it might retest the resistance level of $0.13550. Bitcoin is also facing a bit of retracement which has turned all altcoins a bit bearish.
Technical levels
Major support: $0.097 and $0.086
Major resistance: $0.13550 and $0.17300
Disclaimer
The views and opinions stated by the author, or any people named in this article, are for informational purposes only. They do not establish financial, investment, or other advice. Investing in or trading crypto assets comes with a risk of financial loss.

Andrew is a blockchain developer who developed his interest in cryptocurrencies while pursuing his post-graduation major in blockchain development. He is a keen observer of details and shares his passion for writing, along with coding. His backend knowledge about blockchain helps him give a unique perspective to his writing skills, and a reliable craft at explaining the concepts such as blockchain programming, languages and token minting. He also frequently shares technical details and performance indicators of ICOs and IDOs.


