
 Home
Home News
News
- 1 Ecolab Inc.’s price increased by 0.15% over the last 24 hours.
- 2 The Ecolab Inc. ( NYSE: ECL ) 52-week price range is $143.46 – $187.73.
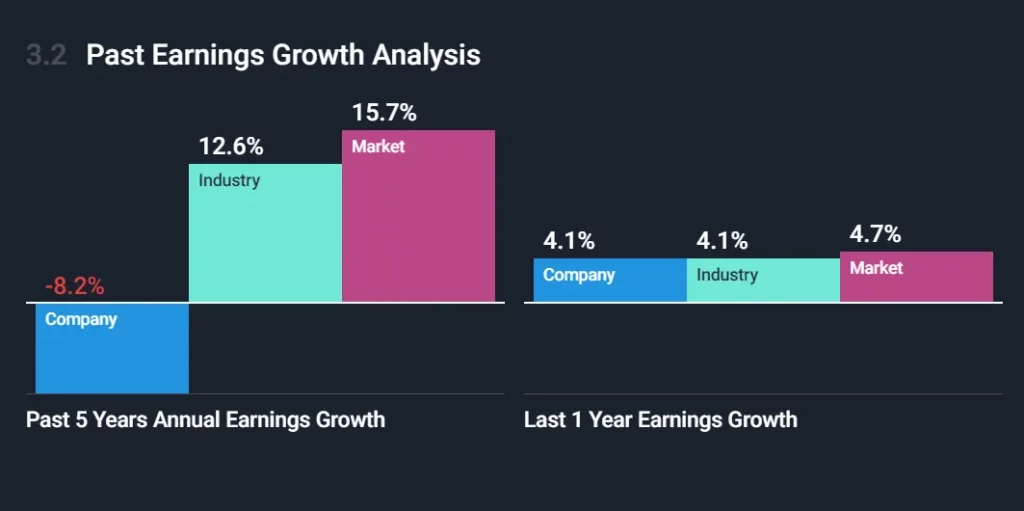
Ecolab’s earnings have been falling by an average of -8.2% per year, while the chemicals industry’s earnings have been rising by 12.6% annually. Ecolab’s revenues have also been dropping by an average of 0.4% yearly. The return on equity is 15.9% with a net margin of 8%.
According to Simplywall, Ecolab has $7.4 Billion in shareholder equity and $8.6 Billion in debt, which gives it a debt-to-equity ratio of 117.1%. Its total assets are $21.3 Billion, and its total liabilities are $13.9 Billion. Ecolab has an EBIT of $1.9 Billion and an interest coverage ratio of 7.1. It has $419.4 Million in cash and short-term investments.
The market capitalization of ECL stock is $52.21 Billion, and the total revenue is $14.19 Billion. Moreover, the stock’s basic EPS is $4.05 and the price-to-earnings ratio is 45.45.
Moreover, this month, the stock performed well as it was up by 6.10%. However, ECL’s price is up by 25.07% over the last six months. Moreover, Ecolab Inc. (NYSE: ECL) stock’s year-to-date return is positive with an increase of 24.72% and its overall 1-year return is positive with an increase of 15.06%.
The price chart of Ecolab Inc. indicates that the average volume is 1.152 Million and the current volume is 1.317 Million. The volume graph reveals that the current volume is slightly higher than the average volume line and the volume is rising daily.
Ecolab Inc., Technical Analysis in 1-D Timeframe
The price action shows that the Ecolab Inc. ( NYSE: ECL ) price bounced back from $164.60, which is the demand zone, and climbed by about 14% forming higher highs and higher lows and reaching a peak of $187.56 within a month.
However, in the last few days, the price broke the higher highs pattern by facing resistance from the trendline near $187.56 and started dropping from there. At the time of publishing the price was $183.40.
The 24-hour volume is above the volume moving average. The price is above all major EMAs as well. A more upward movement in the next coming weeks is expected.
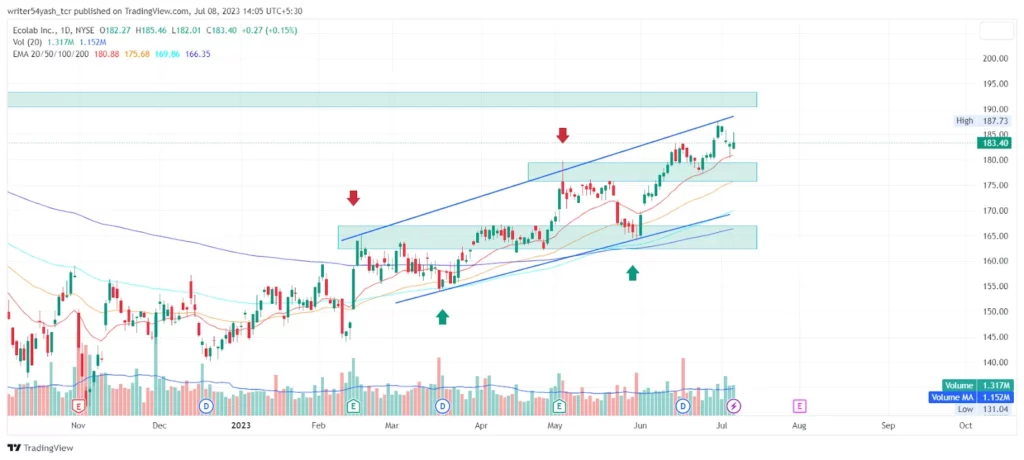
At the time of publishing, the Ecolab Inc. ( NYSE: ECL ) price is trading above the 20, 50, 100, and 200-day EMAs (exponential moving average), which is supporting the price trend. Hence, the coin is expected to move upwards giving bullish views over the daily time frame chart.
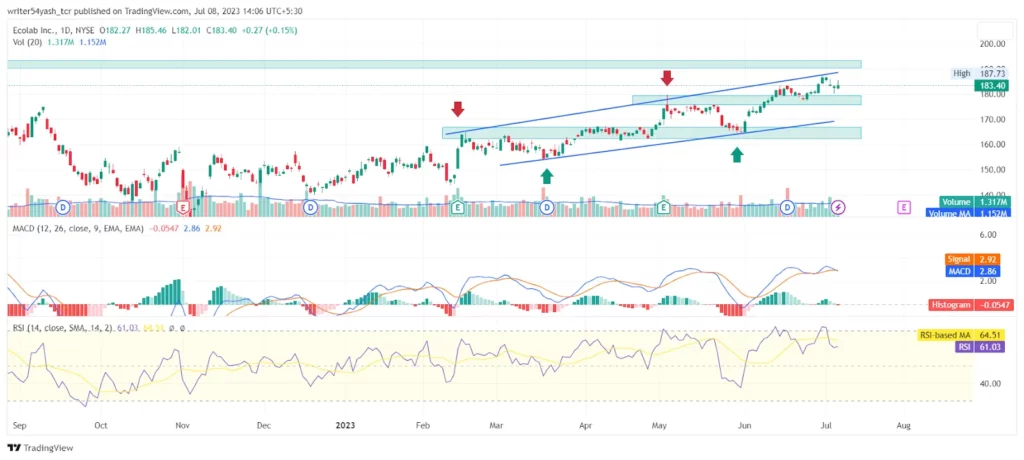
The MACD line at 2.95 and signal line at 4.60 are above the zero line, and the gap between the two is closing suggesting that a crossover is anticipated. The current value of RSI is 61.03 points. The 14 SMA is above the median line at 64.51 points which indicates that the price is in an uptrend and the price might increase further in the upcoming weeks.
Summary
The Ecolab Inc. price indicates that the sentiments and perspectives of investors and traders regarding the ECL stock are bullish on the 1D time frame. Moreover, the ECL stock is in a bullish state as major indicators – MACD, RSI, and EMAs, are giving bullish signals for the ECL stock over the daily time frame.
Technical Levels:
- The nearest support: $177.24 and $163.49.
- The nearest resistance: $187.36 and $202.71.
Disclaimer
In this article, the views and opinions stated by the author or any people named are for informational purposes only, and they don’t establish the investment, financial, or any other advice. Trading or investing in cryptocurrency assets comes with a risk of financial loss.

Adarsh Singh is a true connoisseur of Defi and Blockchain technologies, who left his job at a “Big 4” multinational finance firm to pursue crypto and NFT trading full-time. He has a strong background in finance, with MBA from a prestigious B-school. He delves deep into these innovative fields, unraveling their intricacies. Uncovering hidden gems, be it coins, tokens or NFTs, is his expertise. NFTs drive deep interest for him, and his creative analysis of NFTs opens up engaging narratives. He strives to bring decentralized digital assets accessible to the masses.


