
 Home
Home News
News
- 1 DLTR stock price is hovering with low volumes below $150.
- 2 Bulls are attempting to achieve momentum from the past sessions.
Dollar Tree stock (DLTR) price is trading in a congestion zone and is trying to regain strength. Moreover, the buyers are in a defensive state, gradually stretching the price toward $150, which was the resistance mark so far. The bulls are trying to fill a gap. The price action shows lower highs and lower lows sequence, shedding gains from the supply region of $175, and is now below $150, establishing the top as a correction zone.
However, DLTR stock price is trading above the 20-day EMA but below the 100 and 200-day EMAs, which acts as a barrier for the stock to enter the buying zone. Moreover, the sellers showed dominance in the previous sessions and continued to form short positions.

Dollar Tree operates discount stores in the U.S. and Canada, including 8,647 shops under its namesake banner and 8,016 Family Dollar units (as of the end of fiscal 2021). The eponymous chain features branded and private-label goods, generally at the price of $1.25. Around 45% of Dollar Tree stores’ fiscal 2021 sales came from consumables (including food, health and beauty, and household paper and cleaning products), nearly 50% from variety items (including toys and housewares), and just over 5% from seasonal goods.
DLTR stock was traded at $143.54 at press time with an intraday drop of 0.51%, amid correction in the last session. Moreover, the trading volume was 1.379 Million, and the market cap of DLTR stock is $31.634 Billion.
As per the technicals, DLTR stock has a sell signal based on the recent correction in the price. At the same time, analysts maintained a neutral rating based on the fundamentals and valuations of the stock.
Will DLTR Stock Achieves $150?
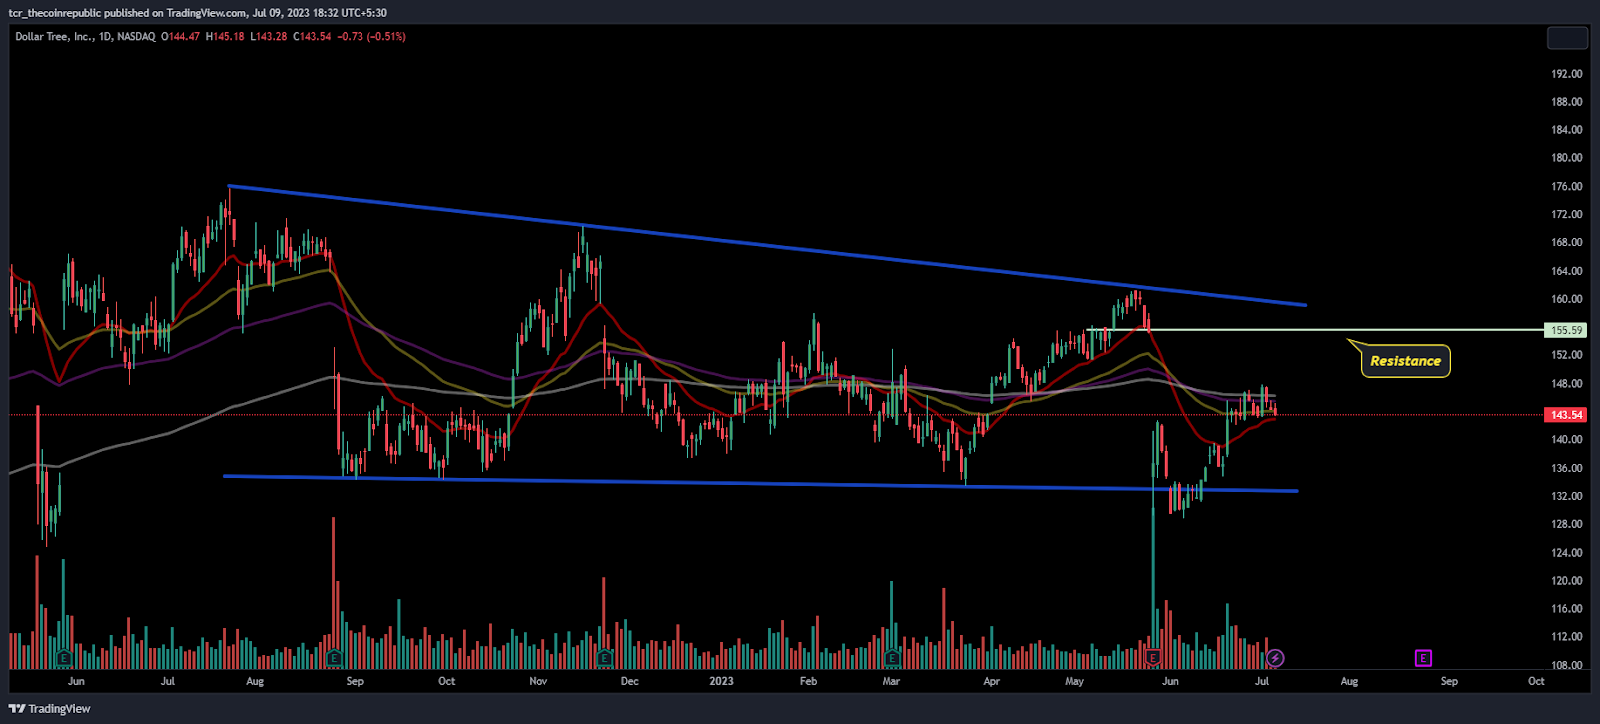
On the daily charts, DLTR stock showed a falling wedge pattern, and trading near the mid bollinger band showed neutral indications on the charts. Moreover, the volume was below average, showing lowering investor interest. Furthermore, the price is stuck around the moving averages, which tightens and does not leave the stock to leave any range.
What the Technical Indicators Show
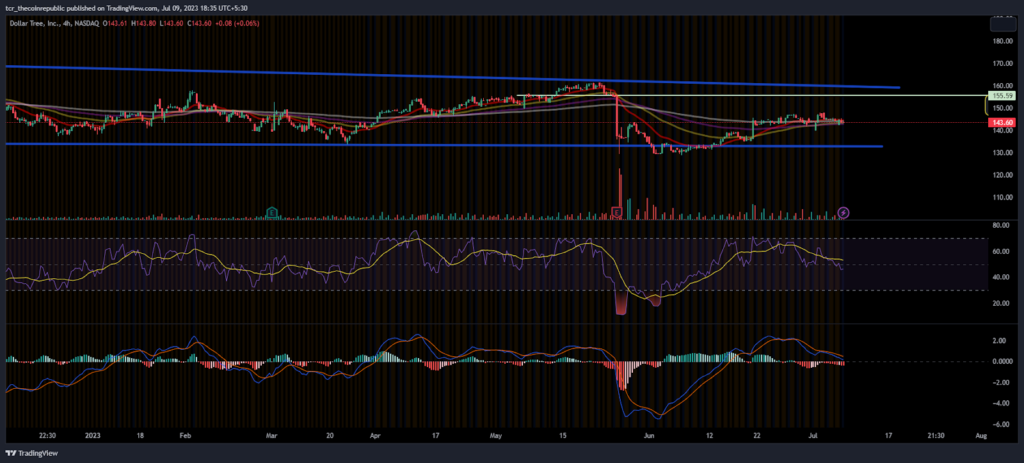
On the 4-hour charts, DLTR stock showed a negative chart structure and showed profit booking on the charts.
The RSI curve showed a steep decline from the overbought zone and is now near 48, showing a negative crossover on the charts.
The MACD indicator also persisted to form red bars on the histogram and showed a bearish crossover indicating seller dominance on the charts.
Conclusion:
Dollar Tree Stock (DLTR) was in a correction phase gradually losing the gains over the top from the previous months. Buyers are now keen to retrieve composure but will need strength.
Technical Levels
Support Levels: $135
Resistance Levels:$155 and $170
Disclaimer
The views and opinions stated by the author, or any people named in this article, are for informational purposes only and do not establish financial, investment, or other advice. Investing in or trading crypto assets comes with a risk of financial loss.

Andrew is a blockchain developer who developed his interest in cryptocurrencies while pursuing his post-graduation major in blockchain development. He is a keen observer of details and shares his passion for writing, along with coding. His backend knowledge about blockchain helps him give a unique perspective to his writing skills, and a reliable craft at explaining the concepts such as blockchain programming, languages and token minting. He also frequently shares technical details and performance indicators of ICOs and IDOs.


