
 Home
Home News
News
- 1 IOTX is trading at $0.019 while seeing a fall of 5.4% in the 24-hour trading volume (press time).
- 2 The IOTX price recorded a decline of 1.96% in the last 7 days.
IOTX price prediction is indicating that IOTX token is trading under the key exponential moving averages within the bear’s grasp. The price is facing resistance from the 50 EMA at present on the daily timeframe. Presently the IOTX token is forming a double-top pattern; taking resistance from $0.02100. The price is facing substantial selling pressure in the supply zone which indicates that bears may push its value down further in the near future.
The technical indicators suggest that bears hold the edge over the price action. The price pattern, oscillators, EMA’s and Volume are moving in tandem, giving similar signals.

IoTeX is the next era of the IoT-oriented blockchain platform with extensive scalability, privacy and development potential. Iotex links the physical world block by block.
Decrease In LunarCrush Levels: IOTX
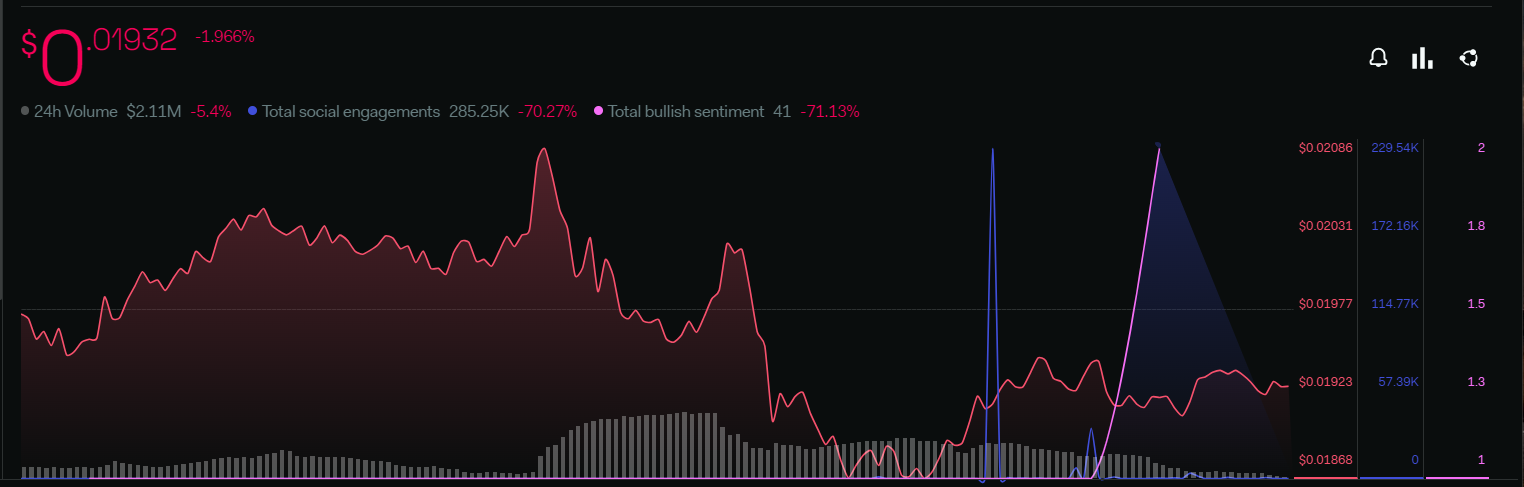
Overall major parameters in the LunarCrush are highlighted in red in the platform.
The total bullish sentiment metric was reduced by 71.13%. A sharp fall of 70.27% was also observed in the total social engagement level.
The decline in overall parameters suggests that the potential buyers in the community are
Greed And Fear Sentiment Index Of Investors

Investor sentiments concerning the overall cryptocurrency market have reached the neutral zone. The sentiment index metric declined slightly within a brief period of time. The current value of the sentiment index is 55 points above the neutral zone as per the Alternative(dot)me platform.
IOTX Price Prediction: Technical Analysis On Daily Timeframe
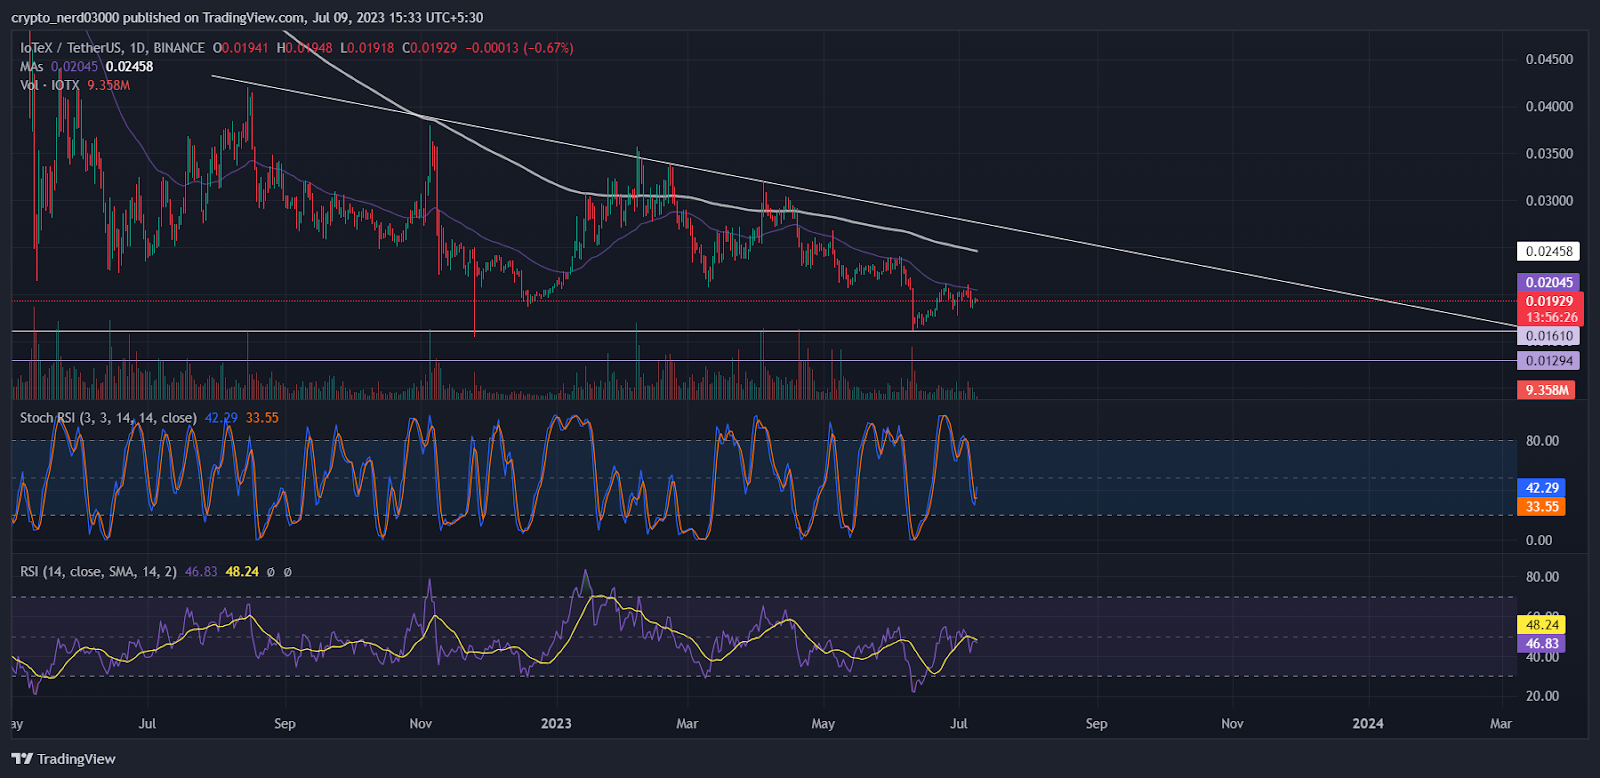
The relative strength index (RSI) line is moving just below the median line. The present value of the RSI is 46.83 points and the value of the 14-day SMA is 48.24 points. The RSI line has been taking constant resistance from the median line.
At present, the stochastic RSI is taking a positive reversal below the neutral zone. The %K line may soon start advancing towards the supply level after crossing above the%D line. The current value of stochastic RSI is 44.08 points.
Conclusion
As per the analysis, IOTX price is facing substantial selling pressure in the supply zone which indicates that bears may push its value down further in the near future. The technical indicators are also moving in tandem which suggests that bears hold the edge over the price action.
Technical Levels:
Support –$0.01600
Resistance – $0.02000
Disclaimer:
The views and opinions stated by the author, or any people named in this article, are for informational purposes only, and they do not establish financial, investment, or other advice. Investing in or trading crypto assets comes with a risk of financial loss.
Steve Anderson is an Australian crypto enthusiast. He is a specialist in management and trading for over 5 years. Steve has worked as a crypto trader, he loves learning about decentralisation, understanding the true potential of the blockchain.


